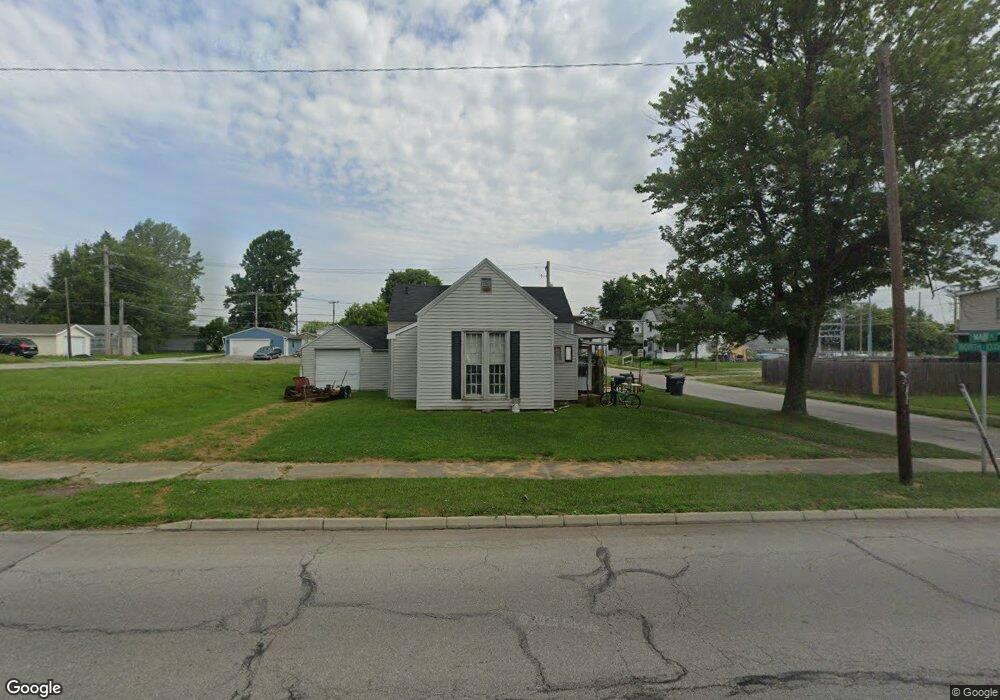
1224 Main St Elwood, IN 46036
Estimated Value: $120,674 - $168,000
2
Beds
1
Bath
1,384
Sq Ft
$99/Sq Ft
Est. Value
About This Home
This home is located at 1224 Main St, Elwood, IN 46036 and is currently estimated at $136,919, approximately $98 per square foot. 1224 Main St is a home located in Madison County with nearby schools including Elwood Elementary School, Elwood Intermediate School, and Elwood Junior-Senior High School.
Ownership History
Date
Name
Owned For
Owner Type
Purchase Details
Closed on
Jun 19, 2024
Sold by
Stansberry Judy C
Bought by
Knotts Samantha and Knotts George
Current Estimated Value
Purchase Details
Closed on
Dec 12, 2008
Sold by
Federal Home Loan Mortgage Corporation
Bought by
Stansberry Judy C and Stansberry John D
Purchase Details
Closed on
Oct 3, 2008
Sold by
Grant Cheryl
Bought by
Federal Home Loan Mortgage Corporation
Purchase Details
Closed on
Apr 1, 2006
Sold by
Grant Cheryl J
Bought by
Lawson James
Create a Home Valuation Report for This Property
The Home Valuation Report is an in-depth analysis detailing your home's value as well as a comparison with similar homes in the area
Home Values in the Area
Average Home Value in this Area
Purchase History
| Date | Buyer | Sale Price | Title Company |
|---|---|---|---|
| Knotts Samantha | -- | None Listed On Document | |
| Stansberry Judy C | -- | -- | |
| Federal Home Loan Mortgage Corporation | $4,500 | -- | |
| Lawson James | -- | -- |
Source: Public Records
Tax History Compared to Growth
Tax History
| Year | Tax Paid | Tax Assessment Tax Assessment Total Assessment is a certain percentage of the fair market value that is determined by local assessors to be the total taxable value of land and additions on the property. | Land | Improvement |
|---|---|---|---|---|
| 2025 | $325 | $32,500 | $12,600 | $19,900 |
| 2024 | $325 | $32,500 | $12,600 | $19,900 |
| 2023 | $602 | $30,100 | $12,000 | $18,100 |
| 2022 | $600 | $29,500 | $11,400 | $18,100 |
| 2021 | $558 | $27,900 | $11,400 | $16,500 |
| 2020 | $542 | $26,600 | $10,900 | $15,700 |
| 2019 | $534 | $26,200 | $10,900 | $15,300 |
| 2018 | $512 | $25,100 | $10,900 | $14,200 |
| 2017 | $500 | $25,000 | $10,900 | $14,100 |
| 2016 | $610 | $30,000 | $10,900 | $19,100 |
| 2014 | $1,216 | $60,800 | $10,900 | $49,900 |
| 2013 | $1,216 | $60,800 | $10,900 | $49,900 |
Source: Public Records
Map
Nearby Homes