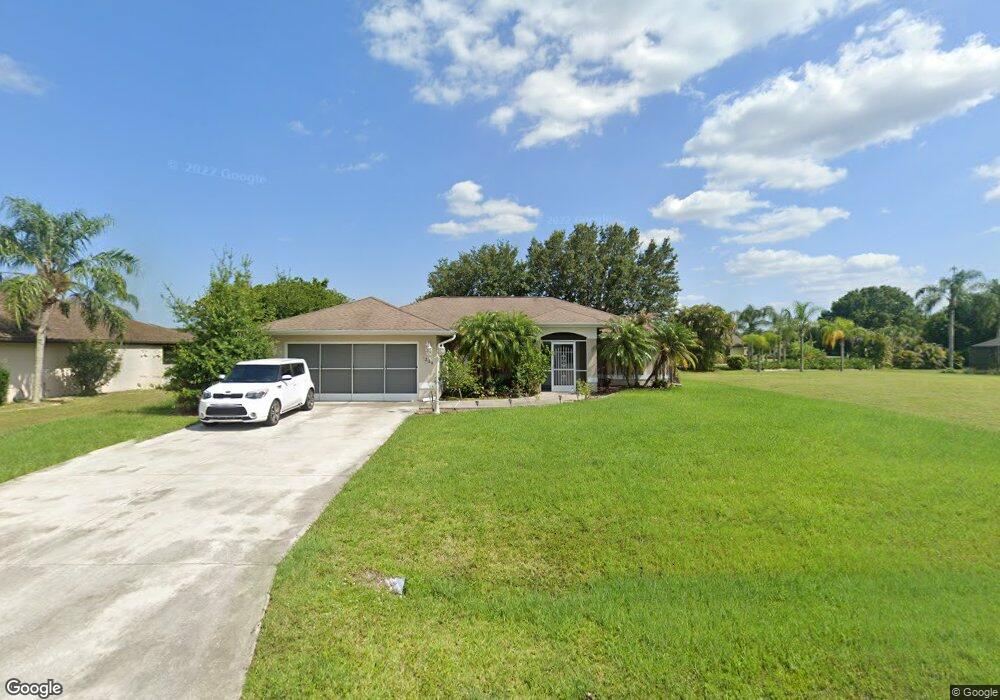
1224 Neapolitan Rd Punta Gorda, FL 33983
Deep Creek NeighborhoodEstimated Value: $301,799 - $366,000
3
Beds
2
Baths
1,708
Sq Ft
$198/Sq Ft
Est. Value
About This Home
This home is located at 1224 Neapolitan Rd, Punta Gorda, FL 33983 and is currently estimated at $337,450, approximately $197 per square foot. 1224 Neapolitan Rd is a home located in Charlotte County with nearby schools including Deep Creek Elementary School, Punta Gorda Middle School, and Charlotte High School.
Ownership History
Date
Name
Owned For
Owner Type
Purchase Details
Closed on
Oct 13, 2020
Sold by
The Bellewood Company Llc
Bought by
Pgi Associates Llc
Current Estimated Value
Purchase Details
Closed on
Sep 28, 2015
Sold by
Bryant Leona J and Bryant Leana J
Bought by
The Bellewood Company Llc
Purchase Details
Closed on
Feb 13, 2007
Sold by
Enos Joseph A and Enos Janet
Bought by
Bryant Casto and Bryant Leana J
Home Financials for this Owner
Home Financials are based on the most recent Mortgage that was taken out on this home.
Original Mortgage
$172,000
Interest Rate
6.17%
Mortgage Type
Purchase Money Mortgage
Purchase Details
Closed on
May 13, 2003
Sold by
Hooper Pamela
Bought by
Enos Joseph A and Enos Janet
Purchase Details
Closed on
Oct 3, 2001
Sold by
Mclaughlin Phillip J
Bought by
Hooper Pamela L
Purchase Details
Closed on
Jul 8, 1998
Sold by
Mclaughlin Phillip J and Mclaughlin Marilyn J
Bought by
Mclaughlin Phillip J
Create a Home Valuation Report for This Property
The Home Valuation Report is an in-depth analysis detailing your home's value as well as a comparison with similar homes in the area
Home Values in the Area
Average Home Value in this Area
Purchase History
| Date | Buyer | Sale Price | Title Company |
|---|---|---|---|
| Pgi Associates Llc | -- | Attorney | |
| The Bellewood Company Llc | $182,000 | Stewart Title Company | |
| Bryant Casto | $215,000 | Gold Crest Title Services | |
| Enos Joseph A | $11,500 | -- | |
| Hooper Pamela L | $9,500 | -- | |
| Mclaughlin Phillip J | -- | -- |
Source: Public Records
Mortgage History
| Date | Status | Borrower | Loan Amount |
|---|---|---|---|
| Previous Owner | Bryant Casto | $172,000 |
Source: Public Records
Tax History
| Year | Tax Paid | Tax Assessment Tax Assessment Total Assessment is a certain percentage of the fair market value that is determined by local assessors to be the total taxable value of land and additions on the property. | Land | Improvement |
|---|---|---|---|---|
| 2025 | $4,821 | $230,877 | $38,250 | $192,627 |
| 2023 | $4,829 | $223,055 | $0 | $0 |
| 2022 | $4,304 | $259,657 | $27,200 | $232,457 |
| 2021 | $3,748 | $184,343 | $17,000 | $167,343 |
| 2020 | $3,596 | $175,847 | $13,600 | $162,247 |
| 2019 | $3,517 | $172,777 | $13,600 | $159,177 |
| 2018 | $3,217 | $165,659 | $11,050 | $154,609 |
| 2017 | $3,064 | $153,995 | $10,625 | $143,370 |
| 2016 | $3,111 | $153,964 | $0 | $0 |
| 2015 | $2,813 | $135,117 | $0 | $0 |
| 2014 | $2,641 | $128,515 | $0 | $0 |
Source: Public Records
Map
Nearby Homes
- 26089 Templar Ln
- 26081 Templar Ln
- 1186 Rio de Janeiro Ave Unit 106
- 1186 Rio de Janeiro Ave Unit 104
- 1216 Rio de Janeiro Ave Unit 301
- 26018 Salonika Ln
- 26028 Northern Cross Rd
- 1328 Neapolitan Rd
- 1246 Rio de Janeiro Ave Unit 505
- 1246 Rio de Janeiro Ave Unit 503
- 1246 Rio de Janeiro Ave Unit J-510
- 1203 Saxony Cir
- 26186 Northern Cross Rd Unit 2A
- 26225 Explorer Rd
- 1326 Saxony Cir
- 1266 Saxony Cir
- 1394 Saxony Cir
- 1900 Nuremberg Blvd
- 1071 Nomad Rd
- 26267 Northern Cross Rd Unit 1
- 1232 Neapolitan Rd
- 1216 Neapolitan Rd
- 1240 Neapolitan Rd
- 1208 Neapolitan Rd
- 26060 Salonika Ln
- 26044 Salonika Ln
- 1233 Neapolitan Rd
- 26097 Templar Ln
- 26068 Salonika Ln
- 1248 Neapolitan Rd
- 1241 Neapolitan Rd
- 1256 Neapolitan Rd
- 26095 Lane
- 26095 Salonika Ln
- 26028 Salonika Ln
- 26087 Salonika Ln
- 26055 Salonika Ln
- 26047 Salonika Ln
- 26098 Templar Ln
- 1257 Neapolitan Rd
Your Personal Tour Guide
Ask me questions while you tour the home.