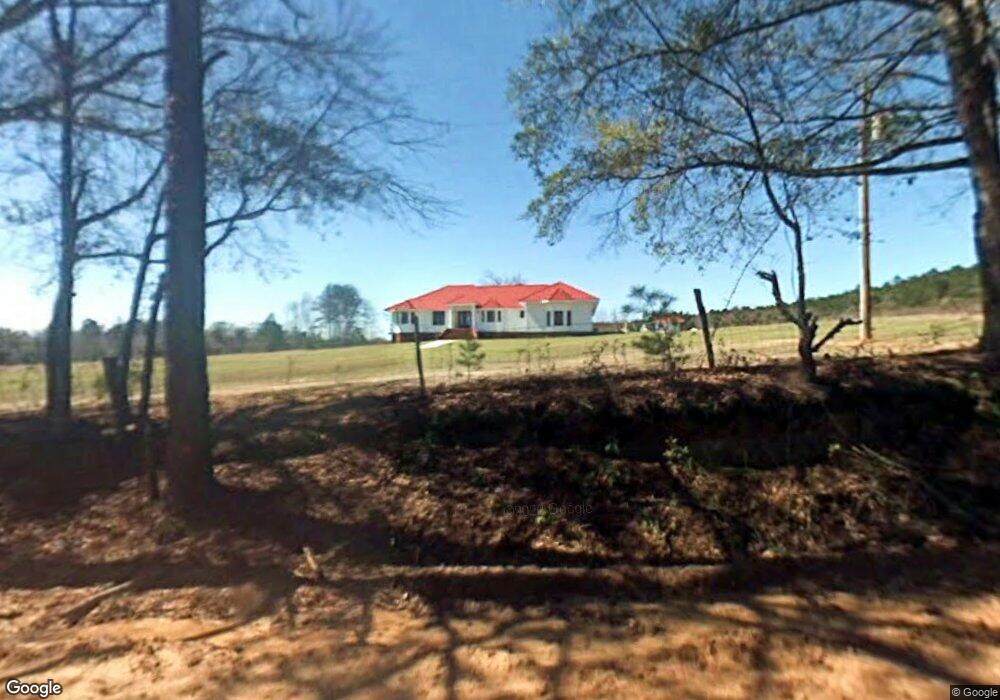
1224 Williams Store Rd Sylvania, GA 30467
Estimated Value: $493,316 - $614,000
4
Beds
4
Baths
4,268
Sq Ft
$134/Sq Ft
Est. Value
About This Home
This home is located at 1224 Williams Store Rd, Sylvania, GA 30467 and is currently estimated at $572,579, approximately $134 per square foot. 1224 Williams Store Rd is a home located in Screven County with nearby schools including Screven County Elementary School, Screven County Middle School, and Screven County High School.
Ownership History
Date
Name
Owned For
Owner Type
Purchase Details
Closed on
Jul 9, 2016
Bought by
Sowell Robert Matthew and Dye Brandi L
Current Estimated Value
Home Financials for this Owner
Home Financials are based on the most recent Mortgage that was taken out on this home.
Original Mortgage
$251,825
Outstanding Balance
$200,077
Interest Rate
3.6%
Mortgage Type
New Conventional
Estimated Equity
$372,502
Purchase Details
Closed on
Oct 6, 2015
Sold by
Williams Maureen S
Bought by
Branch Banking & Trust Co
Purchase Details
Closed on
Dec 28, 2012
Sold by
Williams Billie W
Bought by
Bww Revoc Trust
Purchase Details
Closed on
Feb 9, 2006
Sold by
Williams Billie Walter
Bought by
Williams Billie W and Williams Maureen S
Create a Home Valuation Report for This Property
The Home Valuation Report is an in-depth analysis detailing your home's value as well as a comparison with similar homes in the area
Home Values in the Area
Average Home Value in this Area
Purchase History
| Date | Buyer | Sale Price | Title Company |
|---|---|---|---|
| Sowell Robert Matthew | $244,900 | -- | |
| Branch Banking & Trust Co | -- | -- | |
| Bww Revoc Trust | -- | -- | |
| Williams Billie W | -- | -- |
Source: Public Records
Mortgage History
| Date | Status | Borrower | Loan Amount |
|---|---|---|---|
| Open | Sowell Robert Matthew | $251,825 |
Source: Public Records
Tax History Compared to Growth
Tax History
| Year | Tax Paid | Tax Assessment Tax Assessment Total Assessment is a certain percentage of the fair market value that is determined by local assessors to be the total taxable value of land and additions on the property. | Land | Improvement |
|---|---|---|---|---|
| 2025 | $4,866 | $259,852 | $8,160 | $251,692 |
| 2024 | $4,866 | $174,080 | $6,440 | $167,640 |
| 2023 | $5,007 | $174,080 | $6,440 | $167,640 |
| 2022 | $4,422 | $153,120 | $6,200 | $146,920 |
| 2021 | $4,183 | $137,920 | $5,680 | $132,240 |
| 2020 | $4,180 | $133,560 | $5,680 | $127,880 |
| 2019 | $4,268 | $136,600 | $5,680 | $130,920 |
| 2018 | $3,903 | $136,320 | $5,680 | $130,640 |
| 2017 | $3,903 | $136,320 | $5,680 | $130,640 |
| 2016 | $4,224 | $139,240 | $5,680 | $133,560 |
| 2015 | -- | $135,720 | $5,680 | $130,040 |
| 2014 | -- | $133,840 | $5,680 | $128,160 |
| 2013 | -- | $135,200 | $5,680 | $129,520 |
Source: Public Records
Map
Nearby Homes
- 6585 Newington Hwy
- 1073 Newington Hwy
- 0 Old Poor Robin Unit 10505589
- 0 Old Poor Robin Unit 23279409
- 0 Newington Hwy Unit 10633960
- 0 Newington Hwy Unit 25460805
- 0 Newington Hwy Unit 10633968
- 0 Newington Hwy Unit 25460796
- 1430 Old Poor Robin Rd
- 0 Hunters Rd Unit 25764201
- 0 Buck Creek Rd Unit 10636216
- 0 Buck Creek Rd Unit 25464933
- 301 Beulah Rd
- 001 Beulah Rd
- 0 Cowart Ln
- 388 Whitehill Rd
- 388 White Hill Rd
- 150 Cowart Ln
- Tbd Middle Ground Church Rd
- 509 Whitehill Rd
- 912 Williams Store Rd
- 1124 Williams Store Rd
- 1006 Maple Branch Rd
- 2085 Poor Robin Rd
- 2355 Poor Robin Rd
- 2250 Poor Robin Rd
- 2262 Poor Robin Rd
- 2164 Poor Robin Rd
- 2274 Poor Robin Rd
- 2098 Poor Robin Rd
- 2 N Poor Robin Rd
- N Poor Robin Rd Unit 2 E
- N Poor Robin Rd Unit 2A
- N Poor Robin Rd
- 720 Williams Store Rd
- 681 Williams Store Rd
- 2354 Poor Robin Rd
- 1980 Poor Robin Rd
- 1859 Poor Robin Rd
- 2477 Poor Robin Rd