R
Seller's Agent in 2015
Ron Rast
McKimmey Associates REALTORS NLR

Estimated Value: $143,000 - $193,000
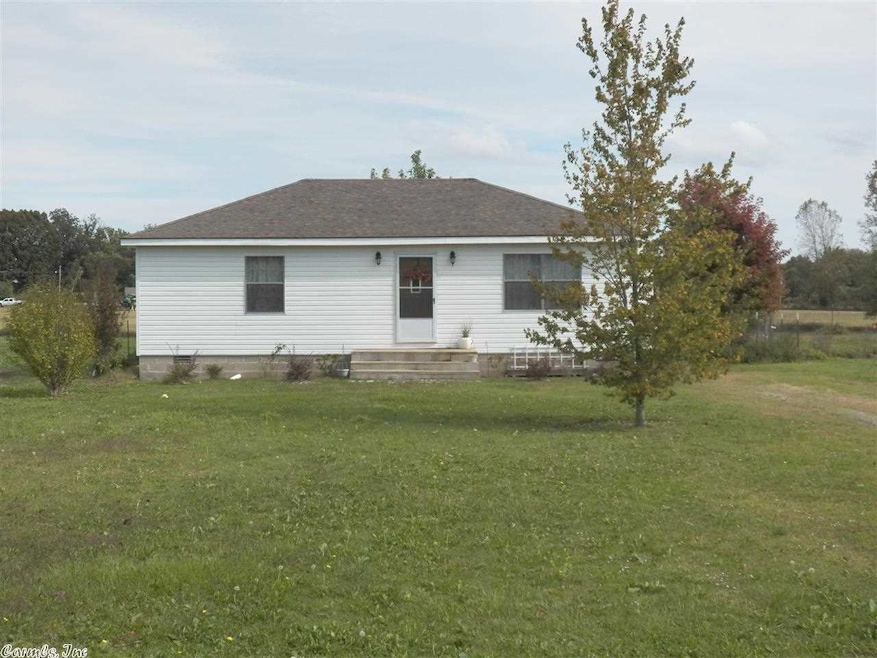
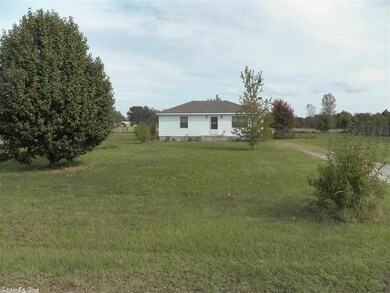
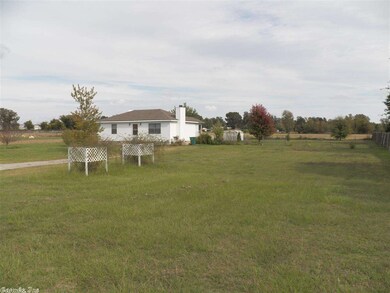
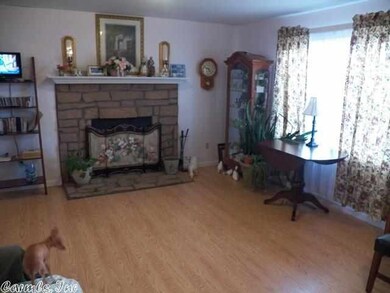
Beautiful home great layout on level one acre lot. Great Starter Home or Investment Opportunity. Sq. Ft. approx. measuring encouraged. See Agent Remarks!
Last Agent to Sell the Property
Ron Rast
McKimmey Associates REALTORS NLR Listed on: 01/28/2015
| Date | Buyer | Sale Price | Title Company |
|---|---|---|---|
| Clark Deborah Ann | $125,000 | Standard Abstract And Ttl Co | |
| Clark Deborah Ann | $125,000 | Standard Abstract & Title | |
| Thompson Cole Lee | $85,500 | First National Title Company | |
| Martin Hazel | -- | -- |
| Date | Status | Borrower | Loan Amount |
|---|---|---|---|
| Open | Clark Deborah Ann | $126,262 | |
| Closed | Clark Deborah Ann | $126,262 | |
| Previous Owner | Thompson Cole Lee | $87,755 |
| Date | Event | Price | List to Sale | Price per Sq Ft |
|---|---|---|---|---|
| 06/25/2015 06/25/15 | Sold | $85,500 | -2.3% | $74 / Sq Ft |
| 05/26/2015 05/26/15 | Pending | -- | -- | -- |
| 01/28/2015 01/28/15 | For Sale | $87,500 | -- | $76 / Sq Ft |
| Year | Tax Paid | Tax Assessment Tax Assessment Total Assessment is a certain percentage of the fair market value that is determined by local assessors to be the total taxable value of land and additions on the property. | Land | Improvement |
|---|---|---|---|---|
| 2025 | $1,218 | $23,980 | $3,200 | $20,780 |
| 2024 | $1,218 | $23,980 | $3,200 | $20,780 |
| 2023 | $1,218 | $23,980 | $3,200 | $20,780 |
| 2022 | $1,355 | $23,980 | $3,200 | $20,780 |
| 2021 | $623 | $13,040 | $2,000 | $11,040 |
| 2020 | $540 | $13,040 | $2,000 | $11,040 |
| 2019 | $238 | $13,040 | $2,000 | $11,040 |
| 2018 | $263 | $13,040 | $2,000 | $11,040 |
| 2017 | $251 | $13,040 | $2,000 | $11,040 |
| 2016 | $251 | $10,620 | $1,100 | $9,520 |
| 2015 | $540 | $10,620 | $1,100 | $9,520 |
| 2014 | $540 | $10,620 | $1,100 | $9,520 |
R
Seller's Agent in 2015
Ron Rast
McKimmey Associates REALTORS NLR

Buyer's Agent in 2015
Barb Roberts
RE/MAX
(501) 350-0066
73 Total Sales
Source: Cooperative Arkansas REALTORS® MLS
MLS Number: 15002695
APN: 14R-031-00-010-10
Disclaimer: Certain information contained herein is derived from information provided by parties other than Homes.com. All information provided is deemed reliable, but is not guaranteed to be accurate and should be independently verified.
![]() IDX information is provided exclusively for personal, non-commercial use, and may not be used for any purpose other than to identify prospective properties consumers may be interested in purchasing.
IDX information is provided exclusively for personal, non-commercial use, and may not be used for any purpose other than to identify prospective properties consumers may be interested in purchasing.
Ask me questions while you tour the home.