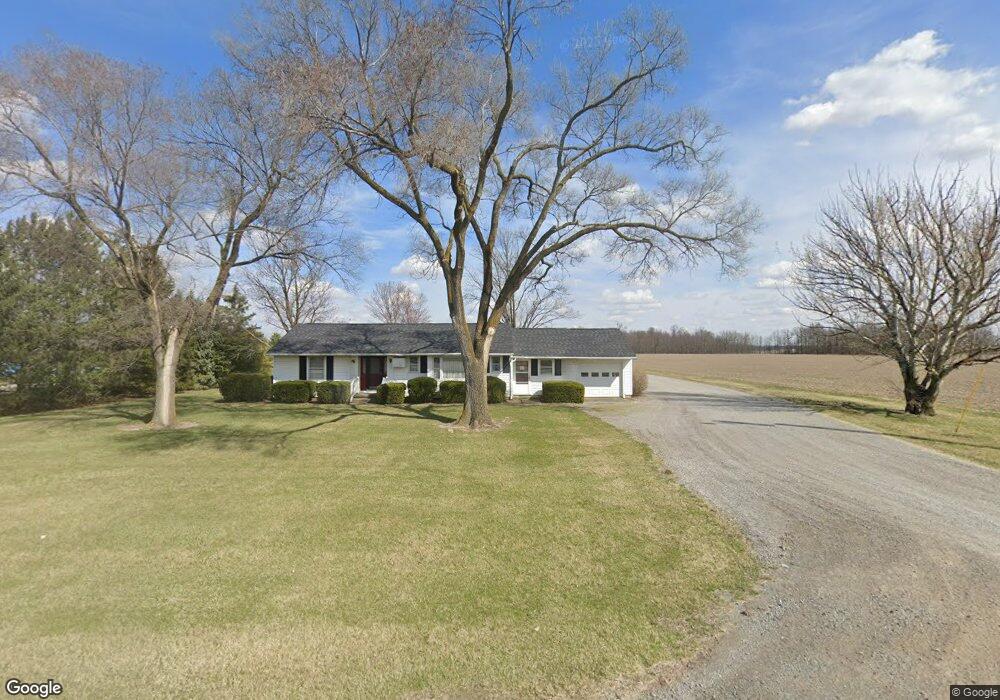
12245 State Route 115 Ottawa, OH 45875
Estimated Value: $81,000 - $166,000
--
Bed
1
Bath
1,356
Sq Ft
$94/Sq Ft
Est. Value
About This Home
This home is located at 12245 State Route 115, Ottawa, OH 45875 and is currently estimated at $126,824, approximately $93 per square foot. 12245 State Route 115 is a home located in Putnam County with nearby schools including Kalida Elementary School and Kalida High School.
Ownership History
Date
Name
Owned For
Owner Type
Purchase Details
Closed on
Dec 26, 2024
Sold by
Vonderembse Gary L and Vonderembse Mary Jo
Bought by
Winkle Jerid L and Winkle Lindsay M
Current Estimated Value
Home Financials for this Owner
Home Financials are based on the most recent Mortgage that was taken out on this home.
Original Mortgage
$81,543
Outstanding Balance
$80,973
Interest Rate
6.78%
Mortgage Type
Seller Take Back
Estimated Equity
$45,851
Purchase Details
Closed on
Jun 24, 2011
Sold by
Vonderembse Gary
Bought by
Vonderembse Gary L and Vonderembse Mary Jo
Purchase Details
Closed on
Mar 9, 2006
Sold by
Stoepfel Philomena
Bought by
Stoepfel John
Purchase Details
Closed on
Feb 14, 2006
Sold by
Stoepfel Philomena
Bought by
Stoepfel John
Purchase Details
Closed on
Dec 21, 2005
Sold by
Stoepfel Philomena
Bought by
Stoepfel John
Create a Home Valuation Report for This Property
The Home Valuation Report is an in-depth analysis detailing your home's value as well as a comparison with similar homes in the area
Home Values in the Area
Average Home Value in this Area
Purchase History
| Date | Buyer | Sale Price | Title Company |
|---|---|---|---|
| Winkle Jerid L | $81,600 | None Listed On Document | |
| Vonderembse Gary L | -- | None Available | |
| Stoepfel John | -- | None Available | |
| Stoepfel John | -- | None Available | |
| Stoepfel John | -- | None Available |
Source: Public Records
Mortgage History
| Date | Status | Borrower | Loan Amount |
|---|---|---|---|
| Open | Winkle Jerid L | $81,543 |
Source: Public Records
Tax History Compared to Growth
Tax History
| Year | Tax Paid | Tax Assessment Tax Assessment Total Assessment is a certain percentage of the fair market value that is determined by local assessors to be the total taxable value of land and additions on the property. | Land | Improvement |
|---|---|---|---|---|
| 2024 | $1,238 | $43,420 | $4,720 | $38,700 |
| 2023 | $1,402 | $32,980 | $3,730 | $29,250 |
| 2022 | $1,176 | $32,981 | $3,731 | $29,250 |
| 2021 | $1,181 | $32,980 | $3,730 | $29,250 |
| 2020 | $1,181 | $24,030 | $3,110 | $20,920 |
| 2019 | $1,033 | $28,860 | $3,730 | $25,130 |
| 2018 | $1,008 | $28,860 | $3,730 | $25,130 |
| 2017 | $840 | $28,860 | $3,730 | $25,130 |
| 2016 | $840 | $24,030 | $3,110 | $20,920 |
| 2015 | $845 | $24,030 | $3,110 | $20,920 |
| 2014 | $834 | $24,030 | $3,110 | $20,920 |
| 2013 | $865 | $24,030 | $3,110 | $20,920 |
Source: Public Records
Map
Nearby Homes
- 106 Carnation St
- 0 Sr 115 & Rd J Unit 6128830
- 0 Sr 115 & Rd J
- 15105 Road 15m
- 20501 U S 224
- 12806 Road K
- 202 S Main St
- 17736 Road 20p
- 204 E Sugar St
- E Road Unit LotWP001
- 203 E Ash St
- 402 S 5th St
- 305 S Main St
- 15735 Road E
- 202 S 5th St
- 717 & 717 1/2 & 721 E Third St
- 304 Oakview (Unit E) Dr
- 406 N Main St
- 301 W Forrest St
- 715 N Perry St
- 12217 State Route 115
- 12194 State Route 115
- 12238 State Route 115
- 12132 State Route 115
- 12130 State Route 115
- 12119 State Route 115
- 17331 Road L
- 17346 Road L
- 17275 Road L
- 11932 State Route 115
- 17231 Road L
- 17278 Road L
- 11891 State Route 115
- 17761 Road L
- 17195 Road L
- 17212 Road L
- 17803 Road L
- 17155 Road L
- 12635 State Route 115
- 17180 Road L