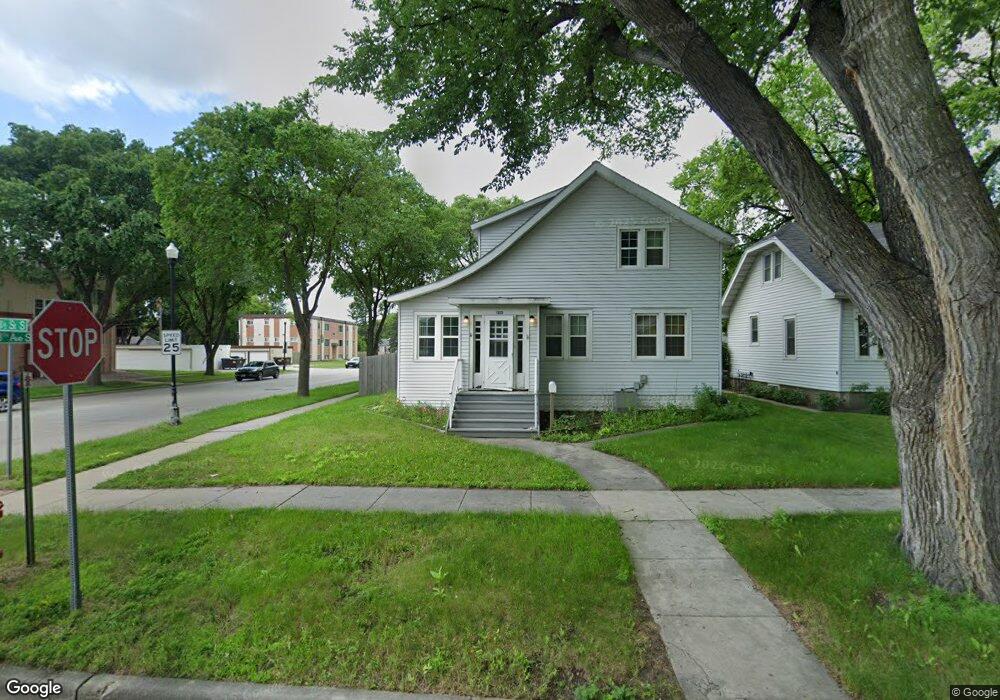
1225 13 1 2 St S Fargo, ND 58103
Jefferson-Carl NeighborhoodEstimated Value: $191,570 - $214,000
2
Beds
1
Bath
1,740
Sq Ft
$117/Sq Ft
Est. Value
About This Home
This home is located at 1225 13 1 2 St S, Fargo, ND 58103 and is currently estimated at $203,143, approximately $116 per square foot. 1225 13 1 2 St S is a home located in Cass County with nearby schools including Clara Barton Elementary School, Carl Ben Eielson Middle School, and South High School.
Ownership History
Date
Name
Owned For
Owner Type
Purchase Details
Closed on
Oct 16, 2020
Sold by
Sailer Rachel M and Sailer Ben
Bought by
Asmussen Matthew R
Current Estimated Value
Home Financials for this Owner
Home Financials are based on the most recent Mortgage that was taken out on this home.
Original Mortgage
$132,800
Outstanding Balance
$95,448
Interest Rate
2.9%
Mortgage Type
New Conventional
Estimated Equity
$107,695
Purchase Details
Closed on
Apr 3, 2015
Sold by
Uetz Erik S and Uetz Melissa A
Bought by
Wagar Rachel M and Sailer Ben
Home Financials for this Owner
Home Financials are based on the most recent Mortgage that was taken out on this home.
Original Mortgage
$130,633
Interest Rate
3.73%
Mortgage Type
New Conventional
Purchase Details
Closed on
Jan 18, 2005
Sold by
Timm Stephen A
Bought by
Uetz Erik S and Uetz Melissa A
Home Financials for this Owner
Home Financials are based on the most recent Mortgage that was taken out on this home.
Original Mortgage
$85,600
Interest Rate
6.24%
Mortgage Type
Adjustable Rate Mortgage/ARM
Create a Home Valuation Report for This Property
The Home Valuation Report is an in-depth analysis detailing your home's value as well as a comparison with similar homes in the area
Home Values in the Area
Average Home Value in this Area
Purchase History
| Date | Buyer | Sale Price | Title Company |
|---|---|---|---|
| Asmussen Matthew R | $166,000 | The Title Company | |
| Wagar Rachel M | $127,000 | None Available | |
| Uetz Erik S | -- | -- |
Source: Public Records
Mortgage History
| Date | Status | Borrower | Loan Amount |
|---|---|---|---|
| Open | Asmussen Matthew R | $132,800 | |
| Previous Owner | Wagar Rachel M | $130,633 | |
| Previous Owner | Uetz Erik S | $85,600 |
Source: Public Records
Tax History Compared to Growth
Tax History
| Year | Tax Paid | Tax Assessment Tax Assessment Total Assessment is a certain percentage of the fair market value that is determined by local assessors to be the total taxable value of land and additions on the property. | Land | Improvement |
|---|---|---|---|---|
| 2024 | $2,543 | $84,300 | $16,350 | $67,950 |
| 2023 | $2,327 | $76,650 | $16,350 | $60,300 |
| 2022 | $2,340 | $75,900 | $16,350 | $59,550 |
| 2021 | $2,086 | $67,750 | $16,350 | $51,400 |
| 2020 | $2,076 | $67,750 | $16,350 | $51,400 |
| 2019 | $1,817 | $58,350 | $9,700 | $48,650 |
| 2018 | $1,797 | $58,350 | $9,700 | $48,650 |
| 2017 | $1,737 | $56,650 | $9,700 | $46,950 |
| 2016 | $1,577 | $55,000 | $9,700 | $45,300 |
| 2015 | $1,680 | $55,650 | $6,650 | $49,000 |
| 2014 | $1,585 | $50,600 | $6,650 | $43,950 |
| 2013 | $653 | $50,600 | $6,650 | $43,950 |
Source: Public Records
Map
Nearby Homes
- 1208 University Dr S
- 1124 University Dr S
- 1314 14th St S
- 1112 University Dr S
- 1418 12th Ave S
- 1418 11th Ave S
- 1301 10th St S
- 1414 10th Ave S
- 910 University Dr S
- 1425 11th St S
- 1020 9th Ave S
- 1439 10th St S
- 1118 8th Ave S
- 1517 9th Ave S
- 820 10th St S Unit C20
- 1301 16 1 2 St S
- 911 8th St S
- 1361 16th Ave S
- 1550 13 1 2 St S
- 1550 14 1 2 St S
- 1225 13 1/2 St S
- 1221 13 1 2 St S
- 1221 13 1/2 St S
- 1217 13 1/2 St S
- 1213 13 1/2 St S
- 1213 13 1 2 St S
- 1226 13 1/2 St S
- 1222 13 1/2 St S
- 1209 13 1/2 St S
- 1209 13 1 2 St S
- 1218 13 1/2 St S
- 1226 14th St S
- 1214 13 1 2 St S
- 1226 14 1/2 St S
- 1222 14th St S
- 1222 14 1/2 St S
- 1218 14th St S
- 1218 14 1/2 St S
- 1214 13 1/2 St S
- 1214 14th St S