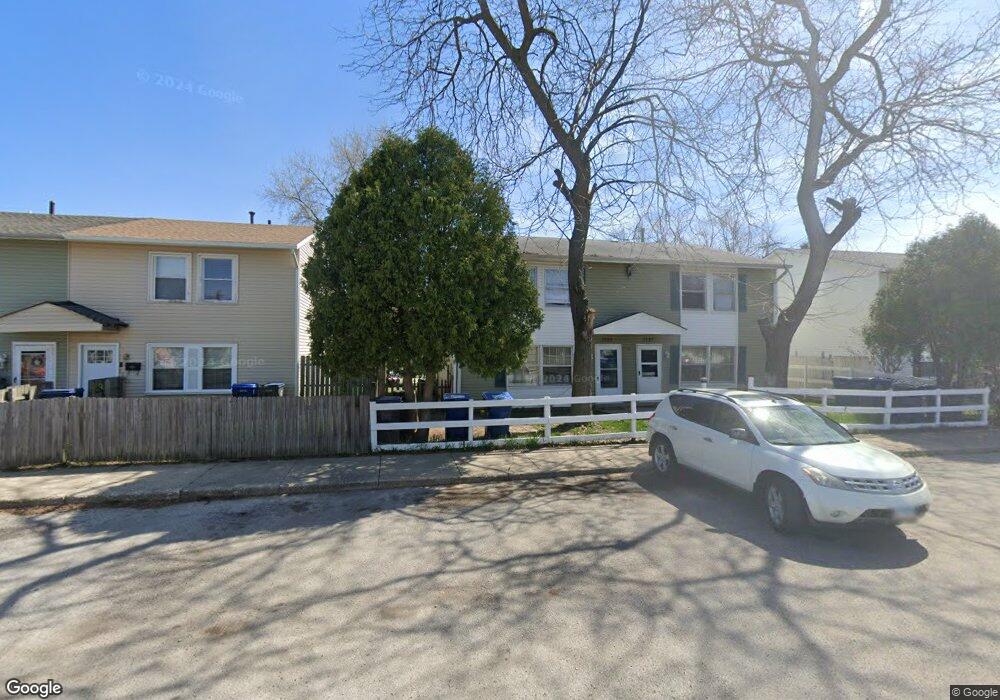
1225 Collier Ct Waukegan, IL 60085
Lewis Glenn NeighborhoodEstimated Value: $164,000 - $223,138
4
Beds
2
Baths
1,280
Sq Ft
$147/Sq Ft
Est. Value
About This Home
This home is located at 1225 Collier Ct, Waukegan, IL 60085 and is currently estimated at $188,535, approximately $147 per square foot. 1225 Collier Ct is a home located in Lake County with nearby schools including Clearview Elementary School, John R Lewis Middle School, and Waukegan High School.
Ownership History
Date
Name
Owned For
Owner Type
Purchase Details
Closed on
Feb 16, 2016
Sold by
Hooczko Marc A
Bought by
Suskin Kenneth and Land Trust Agreement
Current Estimated Value
Purchase Details
Closed on
Mar 5, 2004
Sold by
Dever Mary Clausen and Dever Mary
Bought by
Hooczko Mark
Purchase Details
Closed on
Mar 4, 2004
Sold by
Dever John A and Dever John Andrew
Bought by
Dever Mary
Purchase Details
Closed on
Nov 15, 1996
Sold by
Miller Marian E
Bought by
Dever John Andrew
Home Financials for this Owner
Home Financials are based on the most recent Mortgage that was taken out on this home.
Original Mortgage
$48,000
Interest Rate
8.18%
Create a Home Valuation Report for This Property
The Home Valuation Report is an in-depth analysis detailing your home's value as well as a comparison with similar homes in the area
Home Values in the Area
Average Home Value in this Area
Purchase History
| Date | Buyer | Sale Price | Title Company |
|---|---|---|---|
| Suskin Kenneth | -- | Attorney | |
| Hooczko Mark | -- | -- | |
| Dever Mary | -- | -- | |
| Dever John Andrew | $60,000 | -- |
Source: Public Records
Mortgage History
| Date | Status | Borrower | Loan Amount |
|---|---|---|---|
| Previous Owner | Dever John Andrew | $48,000 |
Source: Public Records
Tax History Compared to Growth
Tax History
| Year | Tax Paid | Tax Assessment Tax Assessment Total Assessment is a certain percentage of the fair market value that is determined by local assessors to be the total taxable value of land and additions on the property. | Land | Improvement |
|---|---|---|---|---|
| 2024 | $3,305 | $41,714 | $5,978 | $35,736 |
| 2023 | $2,698 | $35,723 | $5,119 | $30,604 |
| 2022 | $2,698 | $27,970 | $3,112 | $24,858 |
| 2021 | $2,550 | $24,868 | $2,750 | $22,118 |
| 2020 | $2,584 | $23,168 | $2,562 | $20,606 |
| 2019 | $2,600 | $21,230 | $2,348 | $18,882 |
| 2018 | $1,680 | $13,155 | $2,925 | $10,230 |
| 2017 | $1,646 | $11,639 | $2,588 | $9,051 |
| 2016 | $1,544 | $10,114 | $2,249 | $7,865 |
| 2015 | $1,492 | $15,167 | $2,013 | $13,154 |
| 2014 | $2,705 | $16,232 | $2,186 | $14,046 |
| 2012 | $3,338 | $17,587 | $2,370 | $15,217 |
Source: Public Records
Map
Nearby Homes
- 1712 11th St
- 1511 14th St
- 1244 Victoria Ave
- 1521 Seymour Ave
- 819 S Fulton Ave
- 1617 Grove Ave
- 1423 Victoria Ave
- 1535 Glenn Dr
- 1210 Park Ave
- 720 13th St
- 1301 Park Ave
- 1542 Victoria Ave
- 724 10th St
- 1641 Jackson St
- 1101 Adams St
- 1102 Wadsworth Ave
- 1702 Lincoln St
- 815 Prescott St
- 1815 Hervey Ave
- 842 Wadsworth Ave
- 1227 Collier Ct
- 1221 Collier Ct
- 1233 Collier Ct
- 1217 Collier Ct
- 1237 Collier Ct
- 1213 Collier Ct
- 1209 Collier Ct
- 1228 Collier Ct
- 1232 Collier Ct
- 1224 Collier Ct
- 1205 Collier Ct
- 1236 Collier Ct
- 1220 Collier Ct
- 1216 Collier Ct
- 1240 Collier Ct
- 1212 Collier Ct
- 1201 Collier Ct
- 1217 Washington Park
- 1605 Richard e Bush Ct
- 1607 Richard e Bush Ct