Estimated Value: $263,908 - $400,000
2
Beds
2
Baths
1,638
Sq Ft
$201/Sq Ft
Est. Value
About This Home
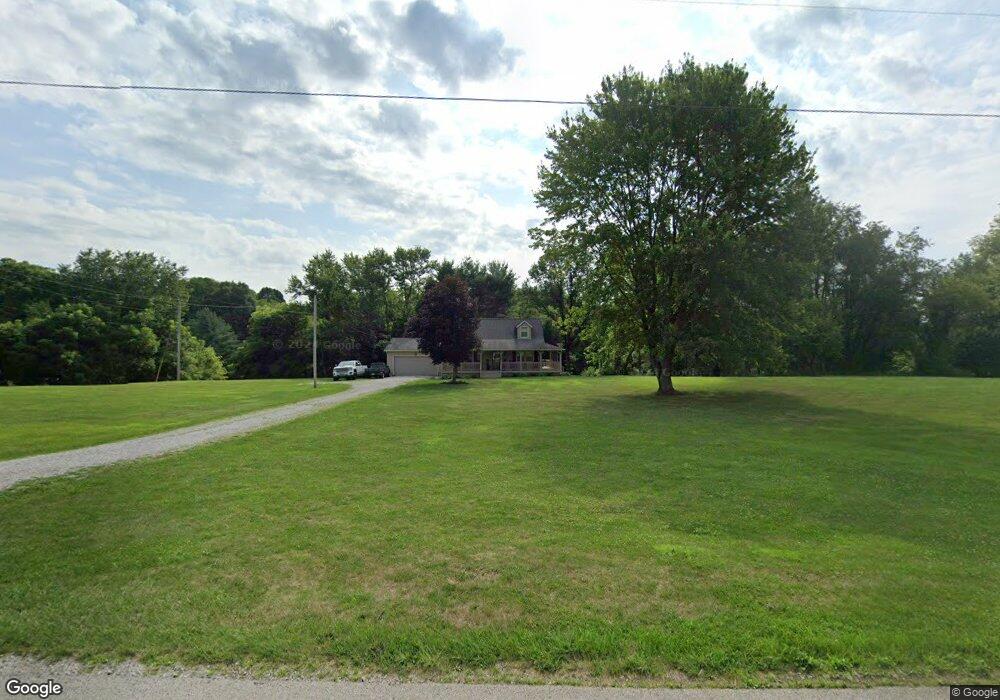
This home is located at 1225 Harlan Rd, Lucas, OH 44843 and is currently estimated at $329,477, approximately $201 per square foot. 1225 Harlan Rd is a home located in Richland County.
Ownership History
Date
Name
Owned For
Owner Type
Purchase Details
Closed on
Mar 8, 2022
Sold by
Jose Ryan S
Bought by
Jose Ryan S and Knipp Naomi R
Current Estimated Value
Home Financials for this Owner
Home Financials are based on the most recent Mortgage that was taken out on this home.
Original Mortgage
$235,000
Outstanding Balance
$208,350
Interest Rate
3.76%
Mortgage Type
New Conventional
Estimated Equity
$121,127
Purchase Details
Closed on
Jul 2, 2020
Sold by
Watson Brent R and Watson Katherine N
Bought by
Maglott Properties Llc
Purchase Details
Closed on
Jan 3, 1991
Sold by
Shaw David L
Bought by
Shaw David L
Purchase Details
Closed on
Jan 1, 1985
Create a Home Valuation Report for This Property
The Home Valuation Report is an in-depth analysis detailing your home's value as well as a comparison with similar homes in the area
Home Values in the Area
Average Home Value in this Area
Purchase History
| Date | Buyer | Sale Price | Title Company |
|---|---|---|---|
| Jose Ryan S | $375 | Southern Title | |
| Maglott Properties Llc | $152,000 | Southern Title | |
| Shaw David L | -- | -- | |
| -- | $9,500 | -- |
Source: Public Records
Mortgage History
| Date | Status | Borrower | Loan Amount |
|---|---|---|---|
| Open | Jose Ryan S | $235,000 |
Source: Public Records
Tax History Compared to Growth
Tax History
| Year | Tax Paid | Tax Assessment Tax Assessment Total Assessment is a certain percentage of the fair market value that is determined by local assessors to be the total taxable value of land and additions on the property. | Land | Improvement |
|---|---|---|---|---|
| 2024 | $3,394 | $67,160 | $7,860 | $59,300 |
| 2023 | $3,394 | $67,160 | $7,860 | $59,300 |
| 2022 | $2,645 | $46,950 | $6,300 | $40,650 |
| 2021 | $2,644 | $46,950 | $6,300 | $40,650 |
| 2020 | $2,664 | $46,950 | $6,300 | $40,650 |
| 2019 | $2,402 | $39,460 | $5,300 | $34,160 |
| 2018 | $2,382 | $39,460 | $5,300 | $34,160 |
| 2017 | $2,379 | $39,460 | $5,300 | $34,160 |
| 2016 | $2,420 | $39,880 | $5,030 | $34,850 |
| 2015 | $2,420 | $39,880 | $5,030 | $34,850 |
| 2014 | $2,372 | $39,880 | $5,030 | $34,850 |
| 2012 | $1,148 | $41,990 | $5,300 | $36,690 |
Source: Public Records
Map
Nearby Homes
- 0 Mount Zion Rd Unit 9069748
- 0 Applegate Rd
- 2750 Lutz Ave
- 2428 Applegate Rd
- 1048 Township Road 2156
- 0 Peterson Rd
- 19 Maine St
- 1183 County Road 30a
- 0 Moffett Rd
- 174 W Main St
- 775 Touby Ln
- 945 Pike Dr
- 1106 County Road 30a
- 0 McBride Road Parcel # 1 Unit 9066028
- 598 Impala Dr
- 0 Satinwood Dr
- 3290 Shad Dr W
- 2364 Satinwood Dr
- 2495 Emma Ln
- 2172 Satinwood Dr