1225 Loretta Ave Columbus, OH 43211
North Linden NeighborhoodEstimated Value: $126,000 - $205,000
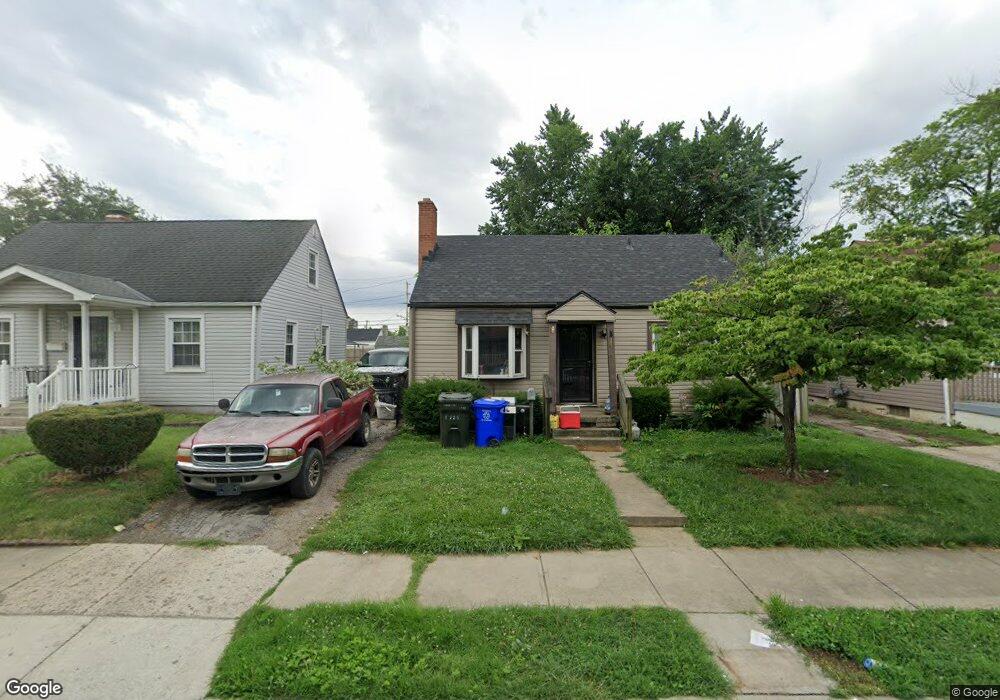
About This Home
This home is located at 1225 Loretta Ave, Columbus, OH 43211 and is currently estimated at $157,022, approximately $147 per square foot. 1225 Loretta Ave is a home located in Franklin County with nearby schools including Linden-Mckinley Stem School On Arcadia, North Columbus Preparatory Academy, and Midnimo Cross Cultural Middle School.
Ownership History
We collect this data history from publicly available records. To have your information removed, we recommend requesting removal directly through your county’s website.
Purchase Details
Purchase Details
Purchase Details
Purchase Details
Purchase Details
Home Financials for this Owner
Home Financials are based on the most recent Mortgage that was taken out on this home.Purchase Details
Home Values in the Area
Average Home Value in this Area
Purchase History
We collect this data history from publicly available records. To have your information removed, we recommend requesting removal directly through your county’s website.
| Date | Buyer | Sale Price | Title Company |
|---|---|---|---|
| $20,000 | Pm Title | ||
| $44,700 | Pm Title Llc | ||
| -- | Pm Title Llc | ||
| -- | Titlequest Agency Inc | ||
| $35,000 | -- | ||
| -- | -- |
Mortgage History
We collect this data history from publicly available records. To have your information removed, we recommend requesting removal directly through your county’s website.
| Date | Status | Borrower | Loan Amount |
|---|---|---|---|
| Previous Owner | $35,787 |
Tax History
We collect this data history from publicly available records. To have your information removed, we recommend requesting removal directly through your county’s website.
| Year | Tax Paid | Tax Assessment Tax Assessment Total Assessment is a certain percentage of the fair market value that is determined by local assessors to be the total taxable value of land and additions on the property. | Land | Improvement |
|---|---|---|---|---|
| 2025 | $2,850 | $26,250 | $10,780 | $15,470 |
| 2024 | $2,850 | $44,420 | $10,780 | $33,640 |
| 2023 | $2,010 | $44,415 | $10,780 | $33,635 |
| 2022 | $423 | $7,000 | $1,960 | $5,040 |
| 2021 | $508 | $7,000 | $1,960 | $5,040 |
| 2020 | $1,038 | $19,470 | $5,500 | $13,970 |
| 2019 | $973 | $15,650 | $4,800 | $10,850 |
| 2018 | $561 | $15,650 | $4,800 | $10,850 |
| 2017 | $949 | $15,650 | $4,800 | $10,850 |
| 2016 | $1,192 | $17,990 | $3,710 | $14,280 |
| 2015 | $541 | $17,990 | $3,710 | $14,280 |
| 2014 | $1,084 | $17,990 | $3,710 | $14,280 |
| 2013 | $630 | $21,175 | $4,375 | $16,800 |
Map
- 2458 Renwood Place
- 1143 Loretta Ave
- 2332 Hamilton Ave
- 2320 Hamilton Ave
- 2532 Renwood Place
- 2488 McGuffey Rd
- 2362 McGuffey Rd
- 1056 Loretta Ave Unit 58
- 2260 Homestead Dr
- 2574 Renwood Place
- 1045 Loretta Ave Unit 47
- 1051-1053 Republic Ave
- 1040-1042 Loretta Ave
- 2579 Lexington Ave
- 2569 Lexington Ave
- 2227 Homestead Dr
- 1408 Briarwood Ave
- 2209 Ontario St
- 2242 Lexington Ave
- 1389 Genessee Ave
- 1218 Loretta Ave
- 1224 Loretta Ave
- 1214 Loretta Ave
- 1228 Loretta Ave
- 1208 Loretta Ave
- 1234 Loretta Ave
- 1223 Republic Ave
- 1238 Loretta Ave
- 1229 Republic Ave
- 1219 Republic Ave
- 1235 Republic Ave
- 1200 Loretta Ave
- 1215 Republic Ave
- 2428 Hamilton Ave
- 1219 Loretta Ave
- 1241 Republic Ave
- 1244 Loretta Ave
- 1207 Loretta Ave
- 1201 Loretta Ave
- 1229 Loretta Ave
Ask me questions while you tour the home.