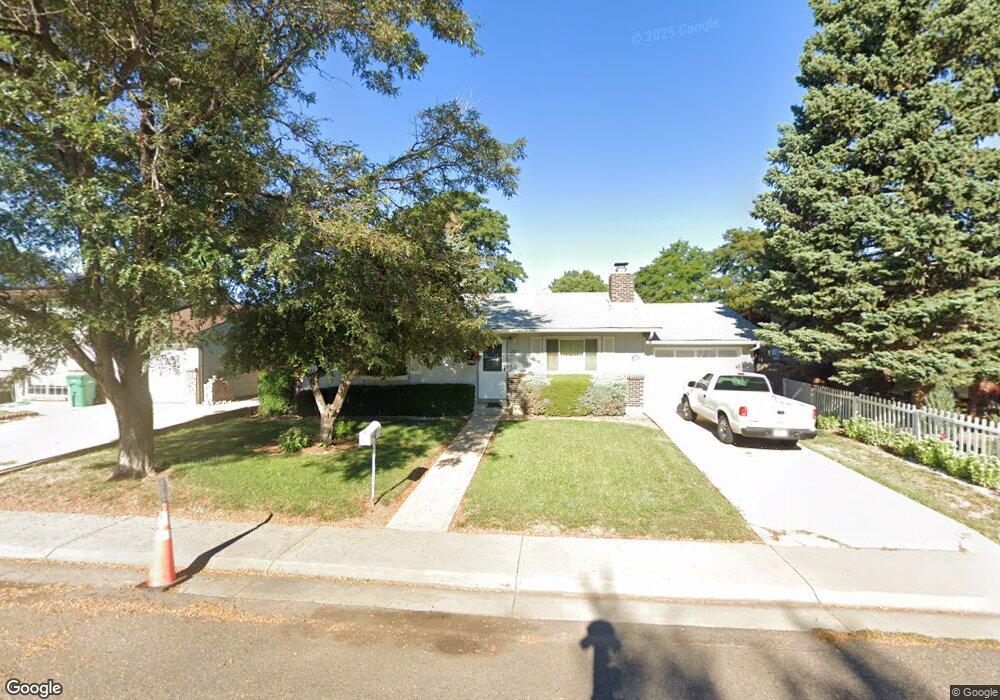
1225 Olathe St Aurora, CO 80011
Laredo Highline NeighborhoodEstimated Value: $434,973 - $455,000
2
Beds
4
Baths
1,104
Sq Ft
$402/Sq Ft
Est. Value
About This Home
This home is located at 1225 Olathe St, Aurora, CO 80011 and is currently estimated at $443,493, approximately $401 per square foot. 1225 Olathe St is a home located in Arapahoe County with nearby schools including Laredo Elementary School, Piute Middle School, and East Middle School.
Ownership History
Date
Name
Owned For
Owner Type
Purchase Details
Closed on
Aug 24, 1998
Sold by
Craft Donnie and Craft Terri A
Bought by
Craft Donnie and Craft Terrie A
Current Estimated Value
Home Financials for this Owner
Home Financials are based on the most recent Mortgage that was taken out on this home.
Original Mortgage
$100,716
Outstanding Balance
$21,048
Interest Rate
6.94%
Mortgage Type
FHA
Estimated Equity
$422,445
Purchase Details
Closed on
Oct 29, 1996
Sold by
Craft Donnie
Bought by
Craft Donnie and Craft Terri A
Purchase Details
Closed on
Apr 30, 1996
Sold by
Coker George R and Coker Kathy G
Bought by
Craft Donnie
Home Financials for this Owner
Home Financials are based on the most recent Mortgage that was taken out on this home.
Original Mortgage
$99,335
Interest Rate
7.8%
Mortgage Type
FHA
Purchase Details
Closed on
Jun 1, 1986
Sold by
Conversion Arapco
Bought by
Conversion Arapco
Purchase Details
Closed on
Jul 4, 1776
Bought by
Conversion Arapco
Create a Home Valuation Report for This Property
The Home Valuation Report is an in-depth analysis detailing your home's value as well as a comparison with similar homes in the area
Home Values in the Area
Average Home Value in this Area
Purchase History
| Date | Buyer | Sale Price | Title Company |
|---|---|---|---|
| Craft Donnie | -- | North American Title | |
| Craft Donnie | -- | -- | |
| Craft Donnie | $99,950 | -- | |
| Conversion Arapco | -- | -- | |
| Conversion Arapco | -- | -- |
Source: Public Records
Mortgage History
| Date | Status | Borrower | Loan Amount |
|---|---|---|---|
| Open | Craft Donnie | $100,716 | |
| Closed | Craft Donnie | $99,335 |
Source: Public Records
Tax History Compared to Growth
Tax History
| Year | Tax Paid | Tax Assessment Tax Assessment Total Assessment is a certain percentage of the fair market value that is determined by local assessors to be the total taxable value of land and additions on the property. | Land | Improvement |
|---|---|---|---|---|
| 2024 | $2,069 | $28,964 | -- | -- |
| 2023 | $2,069 | $28,964 | $0 | $0 |
| 2022 | $1,637 | $23,248 | $0 | $0 |
| 2021 | $1,689 | $23,248 | $0 | $0 |
| 2020 | $1,557 | $22,108 | $0 | $0 |
| 2019 | $2,290 | $22,108 | $0 | $0 |
| 2018 | $1,899 | $17,957 | $0 | $0 |
| 2017 | $1,652 | $17,957 | $0 | $0 |
| 2016 | $1,342 | $14,280 | $0 | $0 |
| 2015 | $1,295 | $14,280 | $0 | $0 |
| 2014 | $904 | $9,600 | $0 | $0 |
| 2013 | -- | $10,910 | $0 | $0 |
Source: Public Records
Map
Nearby Homes
- 1190 Norfolk St
- 1280 Airport Blvd
- 1435 Norfolk St
- 1125 Memphis St
- 757 Norfolk Way
- 16010 E 11th Ave
- 17450 E 14th Dr
- 17400 E 14th Dr
- 1666 Eisenhower Way Unit 166
- 1074 N Joplin St Unit 5
- 1686 Eisenhower Way Unit 170
- 1636 Quintero St
- 1063 N Joplin St Unit 2
- 1053 N Joplin St Unit 1
- 713 Kittredge Ct
- 16485 E 17th Place Unit D
- 1614 Van Buren Way Unit 317
- 15771 E 13th Place Unit C34
- 15775 E 13th Place
- 16211 E 17th Place Unit C