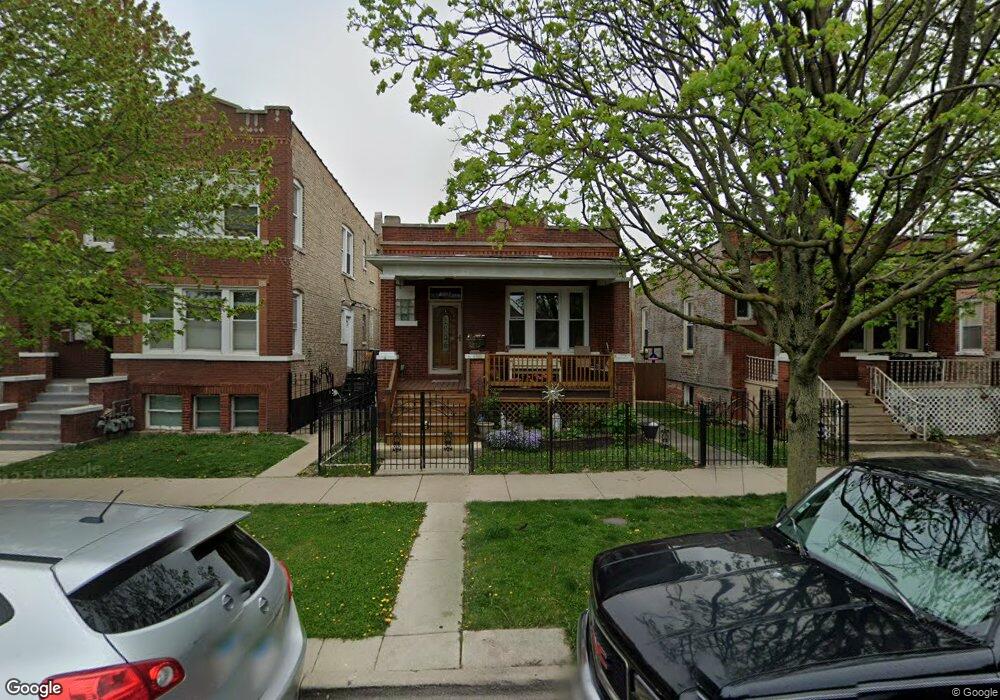
1225 S 61st Ct Cicero, IL 60804
Estimated Value: $283,731 - $294,000
3
Beds
1
Bath
1,104
Sq Ft
$264/Sq Ft
Est. Value
About This Home
This home is located at 1225 S 61st Ct, Cicero, IL 60804 and is currently estimated at $290,933, approximately $263 per square foot. 1225 S 61st Ct is a home located in Cook County with nearby schools including Warren Park Elementary School, J Sterling Morton Freshman Center, and Unity Jr High School.
Ownership History
Date
Name
Owned For
Owner Type
Purchase Details
Closed on
Dec 7, 2004
Sold by
Romero Martin and Romero Elvia
Bought by
Rodriguez Mario
Current Estimated Value
Home Financials for this Owner
Home Financials are based on the most recent Mortgage that was taken out on this home.
Original Mortgage
$178,950
Outstanding Balance
$97,772
Interest Rate
7.12%
Mortgage Type
Unknown
Estimated Equity
$193,161
Purchase Details
Closed on
Nov 21, 1994
Sold by
Borisov George and Meyer Jean M
Bought by
Romero Martin and Romero Elvia
Home Financials for this Owner
Home Financials are based on the most recent Mortgage that was taken out on this home.
Original Mortgage
$79,750
Interest Rate
9%
Mortgage Type
FHA
Purchase Details
Closed on
May 16, 1994
Sold by
Meyer Jean M
Bought by
Borisov George and Meyer Jean M
Home Financials for this Owner
Home Financials are based on the most recent Mortgage that was taken out on this home.
Original Mortgage
$53,500
Interest Rate
8.5%
Create a Home Valuation Report for This Property
The Home Valuation Report is an in-depth analysis detailing your home's value as well as a comparison with similar homes in the area
Home Values in the Area
Average Home Value in this Area
Purchase History
| Date | Buyer | Sale Price | Title Company |
|---|---|---|---|
| Rodriguez Mario | $188,500 | Multiple | |
| Romero Martin | $84,000 | -- | |
| Borisov George | -- | -- |
Source: Public Records
Mortgage History
| Date | Status | Borrower | Loan Amount |
|---|---|---|---|
| Open | Rodriguez Mario | $178,950 | |
| Previous Owner | Romero Martin | $79,750 | |
| Previous Owner | Borisov George | $53,500 |
Source: Public Records
Tax History Compared to Growth
Tax History
| Year | Tax Paid | Tax Assessment Tax Assessment Total Assessment is a certain percentage of the fair market value that is determined by local assessors to be the total taxable value of land and additions on the property. | Land | Improvement |
|---|---|---|---|---|
| 2024 | $5,306 | $19,001 | $4,508 | $14,493 |
| 2023 | $5,495 | $19,001 | $4,508 | $14,493 |
| 2022 | $5,495 | $16,005 | $3,879 | $12,126 |
| 2021 | $5,470 | $16,003 | $3,878 | $12,125 |
| 2020 | $5,414 | $16,003 | $3,878 | $12,125 |
| 2019 | $3,614 | $10,836 | $3,564 | $7,272 |
| 2018 | $3,518 | $10,836 | $3,564 | $7,272 |
| 2017 | $3,414 | $10,836 | $3,564 | $7,272 |
| 2016 | $2,276 | $7,240 | $2,935 | $4,305 |
| 2015 | $2,988 | $8,924 | $2,935 | $5,989 |
| 2014 | $2,905 | $8,924 | $2,935 | $5,989 |
| 2013 | $3,115 | $10,167 | $2,935 | $7,232 |
Source: Public Records
Map
Nearby Homes
- 1318 S 61st Ct
- 1313 Harvey Ave
- 1182 S Taylor Ave
- 1173 S Taylor Ave
- 1336 S Austin Blvd
- 1165 S Humphrey Ave
- 5 Fillmore St Unit 3
- 1501 S 61st Ct
- 1310 S 59th Ave
- 1345 S Cuyler Ave
- 1140 S Harvey Ave
- 1222 Cuyler Ave
- 6337 Roosevelt Rd Unit 103
- 6337 Roosevelt Rd Unit 309
- 6337 Roosevelt Rd Unit 107
- 6337 Roosevelt Rd Unit 308
- 1336 Cuyler Ave
- 1413 Cuyler Ave
- 1505 Highland Ave
- 1314 S 58th Ct