Estimated Value: $108,912 - $145,000
2
Beds
1
Bath
624
Sq Ft
$194/Sq Ft
Est. Value
About This Home
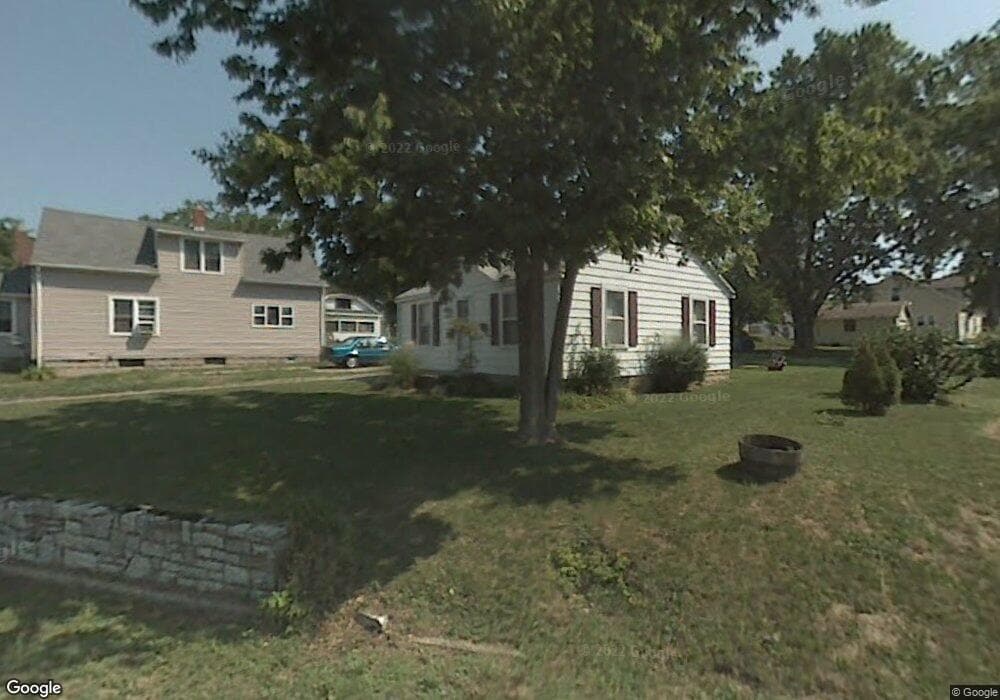
This home is located at 1225 S Mulberry St, Troy, OH 45373 and is currently estimated at $121,228, approximately $194 per square foot. 1225 S Mulberry St is a home located in Miami County with nearby schools including Kyle Elementary School, Van Cleve Elementary School, and Troy Junior High School.
Ownership History
Date
Name
Owned For
Owner Type
Purchase Details
Closed on
Sep 21, 2005
Sold by
Campbell Mary Jane
Bought by
Fullerton Eric W
Current Estimated Value
Home Financials for this Owner
Home Financials are based on the most recent Mortgage that was taken out on this home.
Original Mortgage
$42,000
Outstanding Balance
$22,696
Interest Rate
6.01%
Mortgage Type
New Conventional
Estimated Equity
$98,532
Purchase Details
Closed on
May 28, 2004
Sold by
Campbell Mary Jane
Bought by
Campbell Mary Jane
Purchase Details
Closed on
Apr 23, 2004
Sold by
Estate Of Fred E Davis
Bought by
Campbell Mary Jane
Purchase Details
Closed on
Nov 13, 1992
Bought by
Davis Fred E
Create a Home Valuation Report for This Property
The Home Valuation Report is an in-depth analysis detailing your home's value as well as a comparison with similar homes in the area
Home Values in the Area
Average Home Value in this Area
Purchase History
| Date | Buyer | Sale Price | Title Company |
|---|---|---|---|
| Fullerton Eric W | $52,500 | -- | |
| Campbell Mary Jane | -- | -- | |
| Campbell Mary Jane | -- | -- | |
| Davis Fred E | -- | -- |
Source: Public Records
Mortgage History
| Date | Status | Borrower | Loan Amount |
|---|---|---|---|
| Open | Campbell Mary Jane | $42,000 |
Source: Public Records
Tax History
| Year | Tax Paid | Tax Assessment Tax Assessment Total Assessment is a certain percentage of the fair market value that is determined by local assessors to be the total taxable value of land and additions on the property. | Land | Improvement |
|---|---|---|---|---|
| 2024 | $1,052 | $20,930 | $7,140 | $13,790 |
| 2023 | $859 | $20,930 | $7,140 | $13,790 |
| 2022 | $701 | $20,930 | $7,140 | $13,790 |
| 2021 | $594 | $16,740 | $5,710 | $11,030 |
| 2020 | $595 | $16,740 | $5,710 | $11,030 |
| 2019 | $600 | $16,740 | $5,710 | $11,030 |
| 2018 | $599 | $16,070 | $6,160 | $9,910 |
| 2017 | $605 | $16,070 | $6,160 | $9,910 |
| 2016 | $597 | $16,070 | $6,160 | $9,910 |
| 2015 | $578 | $14,880 | $5,710 | $9,170 |
| 2014 | $578 | $14,880 | $5,710 | $9,170 |
| 2013 | $582 | $14,880 | $5,710 | $9,170 |
Source: Public Records
Map
Nearby Homes
- 712 S Clay St
- 229 W Ross St
- 920 Old Nursery Trail
- 436 S Clay St
- 385 W Ross St
- 504 S Market St
- 517 S Cherry St
- 408 S Market St
- 996 Stony Brook Ln
- 1141 Dickerson Dr
- 1119 Long St
- 1201 Maple St
- 118 S Walnut St
- 216 S Short St
- 339 Lincoln Ave
- 229 Grant St
- 1426 Paul Revere Way Unit B
- 1426 Paul Revere Way Unit D
- 509 Mckaig Ave
- 425 W Franklin St
- 1223 S Mulberry St
- 1227 S Mulberry St
- 1221 S Mulberry St
- 1206 S Clay St
- 1208 S Clay St
- 220 Racer St
- 1210 S Clay St
- 1219 S Mulberry St
- 1212 S Clay St
- 0 Elmwood Ave
- 1118 S Clay St
- 1217 S Mulberry St
- 1302 S Clay St
- 1000 S Market St
- 1116 S Clay St
- 1209 S Mulberry St
- 1216 S Mulberry St
- 1114 S Clay St
- 1304 S Clay St
- 1215 S Clay St
Your Personal Tour Guide
Ask me questions while you tour the home.