Estimated Value: $582,000 - $812,000
5
Beds
5
Baths
3,281
Sq Ft
$225/Sq Ft
Est. Value
About This Home
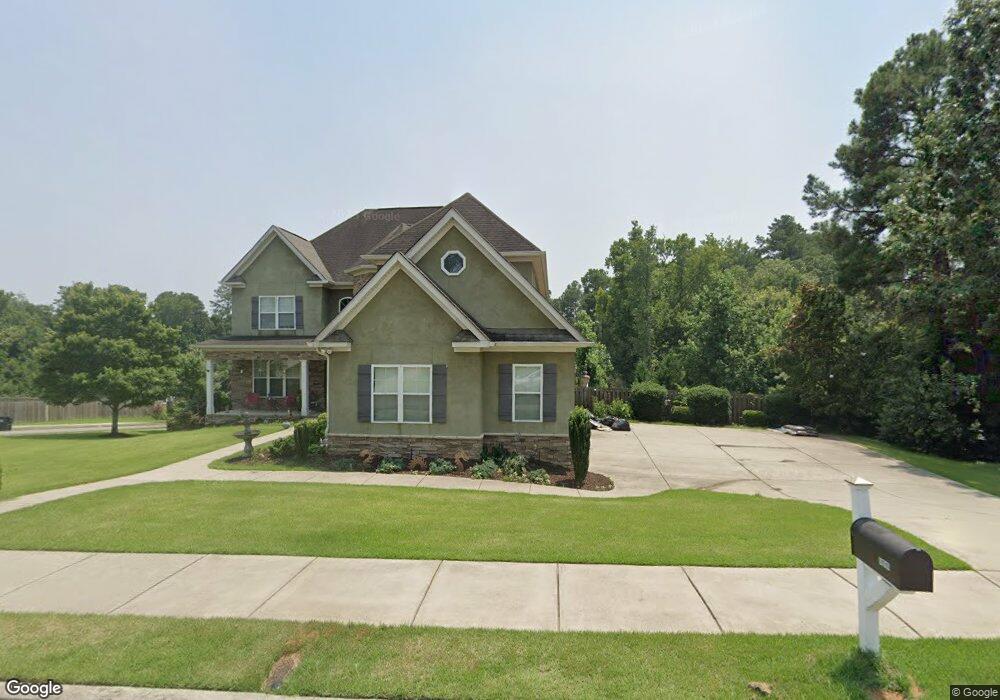
This home is located at 1225 Sumter Landing Ln, Evans, GA 30809 and is currently estimated at $738,165, approximately $224 per square foot. 1225 Sumter Landing Ln is a home located in Columbia County with nearby schools including River Ridge Elementary School, Riverside Middle School, and Greenbrier High School.
Ownership History
Date
Name
Owned For
Owner Type
Purchase Details
Closed on
May 9, 2019
Sold by
Garland Lewis R
Bought by
Napier Kendra
Current Estimated Value
Purchase Details
Closed on
Jun 27, 2017
Sold by
Napier Harley D
Bought by
Napier Kendra
Purchase Details
Closed on
Mar 5, 2010
Sold by
Rt Bailey Const Inc
Bought by
Napier Ii Harley D
Home Financials for this Owner
Home Financials are based on the most recent Mortgage that was taken out on this home.
Original Mortgage
$332,800
Interest Rate
5.01%
Mortgage Type
New Conventional
Purchase Details
Closed on
Nov 14, 2008
Sold by
Sumter Landing Assoc Llc
Bought by
Rt Bailey Const Inc
Create a Home Valuation Report for This Property
The Home Valuation Report is an in-depth analysis detailing your home's value as well as a comparison with similar homes in the area
Home Values in the Area
Average Home Value in this Area
Purchase History
| Date | Buyer | Sale Price | Title Company |
|---|---|---|---|
| Napier Kendra | -- | -- | |
| Napier Kendra | -- | -- | |
| Napier Ii Harley D | $489,900 | -- | |
| Rt Bailey Const Inc | $45,000 | -- |
Source: Public Records
Mortgage History
| Date | Status | Borrower | Loan Amount |
|---|---|---|---|
| Previous Owner | Napier Ii Harley D | $332,800 |
Source: Public Records
Tax History Compared to Growth
Tax History
| Year | Tax Paid | Tax Assessment Tax Assessment Total Assessment is a certain percentage of the fair market value that is determined by local assessors to be the total taxable value of land and additions on the property. | Land | Improvement |
|---|---|---|---|---|
| 2025 | $7,107 | $295,639 | $35,604 | $260,035 |
| 2024 | $7,337 | $291,414 | $31,404 | $260,010 |
| 2023 | $7,337 | $277,630 | $30,604 | $247,026 |
| 2022 | $6,464 | $246,620 | $29,204 | $217,416 |
| 2021 | $5,627 | $204,895 | $24,104 | $180,791 |
| 2020 | $5,519 | $196,733 | $23,804 | $172,929 |
| 2019 | $5,401 | $192,506 | $23,204 | $169,302 |
| 2018 | $5,026 | $178,385 | $20,804 | $157,581 |
| 2017 | $5,181 | $183,310 | $20,604 | $162,706 |
| 2016 | $5,008 | $183,685 | $21,980 | $161,705 |
| 2015 | $5,136 | $188,074 | $21,980 | $166,094 |
| 2014 | $5,250 | $189,925 | $27,180 | $162,745 |
Source: Public Records
Map
Nearby Homes
- 1085 Conn Dr
- 1088 Conn Dr
- 1103 Sumter Landing Cir
- 2003 Sumter Landing Cir
- 524 Mauldin Dr
- 4196 Aerie Cir
- 820 Jasmine Trail
- 4161 Eagle Nest Dr
- 4111 Rivermont Dr
- 905 River Bound Ct
- 330 Frog Hollow Ct
- 1144 Hunters Cove
- 1142 Hunters Cove
- 959 Hunting Horn Way W
- 756 Winding Creek Ct
- 4116 Fox Brush Dr
- 877 Chase Rd
- 4183 Quinn Dr
- 4145 Culbreath Dr
- 889 Hunting Horn Way E
- 903 Sumter Landing Ct
- 1114 Sumter Landing Cir
- 1221 Sumter Landing Ln
- 1110 Sumter Landing Cir
- 1228 Sumter Landing Ln
- 1118 Sumter Landing Cir
- 902 Sumter Landing Ct
- 1226 Sumter Landing Ln
- 1108 Sumter Landing Cir
- 1219 Sumter Landing Ln
- 1224 Sumter Landing Ln
- 904 Sumter Landing Ct
- 1106 Sumter Landing Cir
- 1117 Sumter Landing Cir
- 1119 Sumter Landing Cir
- 1126 Sumter Landing Cir
- 1222 Sumter Landing Ln
- 1115 Sumter Landing Cir
- 1121 Sumter Landing Cir
- 1217 Sumter Landing Ln