Estimated Value: $402,000 - $454,000
5
Beds
3
Baths
2,692
Sq Ft
$157/Sq Ft
Est. Value
About This Home
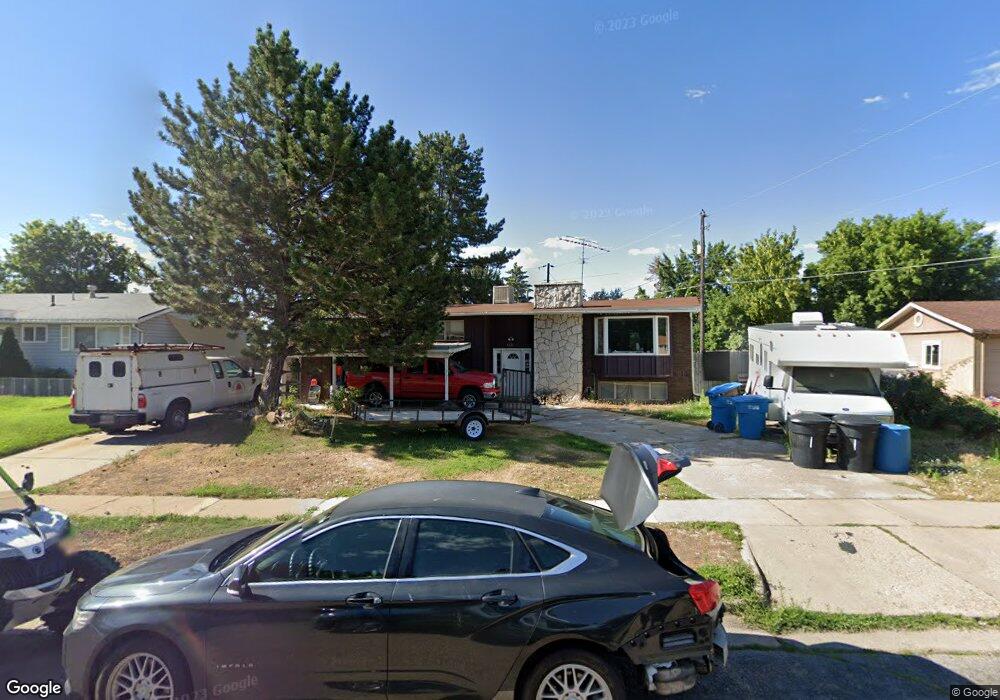
This home is located at 1225 W 4575 S, Ogden, UT 84405 and is currently estimated at $423,756, approximately $157 per square foot. 1225 W 4575 S is a home located in Weber County with nearby schools including Riverdale School, T.H. Bell Junior High School, and Bonneville High School.
Ownership History
Date
Name
Owned For
Owner Type
Purchase Details
Closed on
Dec 8, 2010
Sold by
Olson Eric John
Bought by
Dangerfield William H
Current Estimated Value
Home Financials for this Owner
Home Financials are based on the most recent Mortgage that was taken out on this home.
Original Mortgage
$159,225
Interest Rate
5.25%
Mortgage Type
FHA
Purchase Details
Closed on
Jun 2, 2009
Sold by
Olsen Eric John and Olson Eric John
Bought by
Olson Eric John
Home Financials for this Owner
Home Financials are based on the most recent Mortgage that was taken out on this home.
Original Mortgage
$109,900
Interest Rate
4.78%
Mortgage Type
New Conventional
Purchase Details
Closed on
Sep 11, 2006
Sold by
Martinez Derek
Bought by
Olsen Eric John
Home Financials for this Owner
Home Financials are based on the most recent Mortgage that was taken out on this home.
Original Mortgage
$124,000
Interest Rate
6.67%
Mortgage Type
Purchase Money Mortgage
Purchase Details
Closed on
Jan 9, 2006
Sold by
Burningham Thomas
Bought by
Martinez Derek
Home Financials for this Owner
Home Financials are based on the most recent Mortgage that was taken out on this home.
Original Mortgage
$29,320
Interest Rate
5.8%
Mortgage Type
Stand Alone Second
Purchase Details
Closed on
Aug 19, 2005
Sold by
Garcia Rosemary and Garcia John C
Bought by
Burningham Thomas
Purchase Details
Closed on
Sep 29, 2000
Sold by
Gailey Shirley T and Gailey Van C
Bought by
Garcia Rosemary and Garcia John C
Home Financials for this Owner
Home Financials are based on the most recent Mortgage that was taken out on this home.
Original Mortgage
$145,247
Interest Rate
8.01%
Mortgage Type
FHA
Purchase Details
Closed on
Mar 30, 1999
Sold by
Gailey Van C and Gailey Shirley T
Bought by
Gailey Van C and Gailey Shirley T
Home Financials for this Owner
Home Financials are based on the most recent Mortgage that was taken out on this home.
Original Mortgage
$95,000
Interest Rate
6.79%
Create a Home Valuation Report for This Property
The Home Valuation Report is an in-depth analysis detailing your home's value as well as a comparison with similar homes in the area
Home Values in the Area
Average Home Value in this Area
Purchase History
| Date | Buyer | Sale Price | Title Company |
|---|---|---|---|
| Dangerfield William H | -- | Metro National Title | |
| Olson Eric John | -- | Bonneville Superior Title Co | |
| Olsen Eric John | -- | None Available | |
| Martinez Derek | -- | Inwest Title Ogden | |
| Burningham Thomas | -- | Backman | |
| Garcia Rosemary | -- | Bonneville Title Company | |
| Gailey Van C | -- | Associated Title |
Source: Public Records
Mortgage History
| Date | Status | Borrower | Loan Amount |
|---|---|---|---|
| Previous Owner | Dangerfield William H | $159,225 | |
| Previous Owner | Olson Eric John | $109,900 | |
| Previous Owner | Olsen Eric John | $124,000 | |
| Previous Owner | Martinez Derek | $29,320 | |
| Previous Owner | Martinez Derek | $117,280 | |
| Previous Owner | Garcia Rosemary | $145,247 | |
| Previous Owner | Gailey Van C | $95,000 |
Source: Public Records
Tax History
| Year | Tax Paid | Tax Assessment Tax Assessment Total Assessment is a certain percentage of the fair market value that is determined by local assessors to be the total taxable value of land and additions on the property. | Land | Improvement |
|---|---|---|---|---|
| 2025 | $2,185 | $386,477 | $135,808 | $250,669 |
| 2024 | $2,089 | $207,899 | $74,694 | $133,205 |
| 2023 | $1,994 | $196,900 | $75,430 | $121,470 |
| 2022 | $1,923 | $193,601 | $61,903 | $131,698 |
| 2021 | $1,488 | $274,000 | $62,778 | $211,222 |
| 2020 | $1,448 | $246,000 | $53,172 | $192,828 |
| 2019 | $1,461 | $235,000 | $52,198 | $182,802 |
| 2018 | $1,378 | $212,000 | $52,198 | $159,802 |
| 2017 | $1,260 | $185,000 | $40,257 | $144,743 |
| 2016 | $1,099 | $87,763 | $21,466 | $66,297 |
| 2015 | $1,098 | $85,748 | $21,466 | $64,282 |
| 2014 | $1,105 | $85,289 | $21,466 | $63,823 |
Source: Public Records
Map
Nearby Homes
- 1114 W 4650 S
- 1198 W 4400 S Unit V
- 4418 S 850 W Unit 14
- 1075 W 4175 S
- 5125 S 1250 W
- 5124 S 1275 W
- 902 W 4200 S
- 4598 S Blossom Glen Way
- 4602 Hathaway Dr
- 4196 S 800 W
- 5100 S 1050 W Unit G111
- 5100 S 1050 W Unit E33
- 5100 S 1050 W Unit C123
- 5100 S 1050 W Unit B92
- 5100 S 1050 W Unit H134
- 5100 S 1050 W Unit J213
- 5100 S 1050 W Unit F59
- 1765 W 5000 S
- 1783 W 5000 S
- 4375 Weber River Dr Unit 44
Your Personal Tour Guide
Ask me questions while you tour the home.