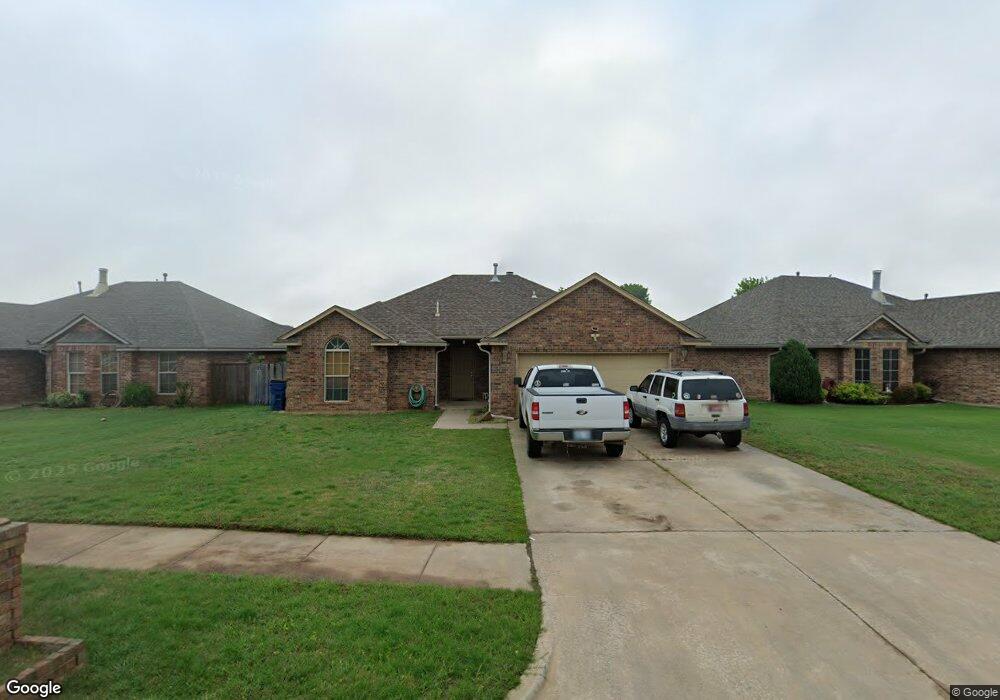
1225 W Johnathan Way Mustang, OK 73064
Estimated Value: $204,000 - $222,000
3
Beds
2
Baths
1,342
Sq Ft
$159/Sq Ft
Est. Value
About This Home
This home is located at 1225 W Johnathan Way, Mustang, OK 73064 and is currently estimated at $213,458, approximately $159 per square foot. 1225 W Johnathan Way is a home located in Canadian County with nearby schools including Mustang Lakehoma Elementary School, Mustang Horizon Intermediate School, and Mustang Middle School.
Ownership History
Date
Name
Owned For
Owner Type
Purchase Details
Closed on
Nov 11, 2009
Sold by
Paben Shane
Bought by
York Kevin
Current Estimated Value
Home Financials for this Owner
Home Financials are based on the most recent Mortgage that was taken out on this home.
Original Mortgage
$124,699
Outstanding Balance
$80,713
Interest Rate
4.83%
Estimated Equity
$132,745
Purchase Details
Closed on
Mar 27, 2008
Sold by
Daddy Ernie L L C
Bought by
Paben Shane E
Home Financials for this Owner
Home Financials are based on the most recent Mortgage that was taken out on this home.
Original Mortgage
$111,700
Interest Rate
5.72%
Mortgage Type
FHA
Purchase Details
Closed on
Sep 27, 2007
Sold by
Lynndee Properties Llc
Bought by
Daddy Emie Llc
Home Financials for this Owner
Home Financials are based on the most recent Mortgage that was taken out on this home.
Original Mortgage
$102,458
Interest Rate
6.66%
Mortgage Type
Small Business Administration
Create a Home Valuation Report for This Property
The Home Valuation Report is an in-depth analysis detailing your home's value as well as a comparison with similar homes in the area
Home Values in the Area
Average Home Value in this Area
Purchase History
| Date | Buyer | Sale Price | Title Company |
|---|---|---|---|
| York Kevin | $127,000 | None Available | |
| Paben Shane E | $113,500 | Capitol Abstract & Title Co | |
| Daddy Emie Llc | $17,250 | None Available |
Source: Public Records
Mortgage History
| Date | Status | Borrower | Loan Amount |
|---|---|---|---|
| Open | York Kevin | $124,699 | |
| Previous Owner | Paben Shane E | $111,700 | |
| Previous Owner | Daddy Emie Llc | $102,458 |
Source: Public Records
Tax History Compared to Growth
Tax History
| Year | Tax Paid | Tax Assessment Tax Assessment Total Assessment is a certain percentage of the fair market value that is determined by local assessors to be the total taxable value of land and additions on the property. | Land | Improvement |
|---|---|---|---|---|
| 2024 | $1,714 | $18,728 | $2,760 | $15,968 |
| 2023 | $1,714 | $18,183 | $2,760 | $15,423 |
| 2022 | $1,681 | $17,653 | $2,760 | $14,893 |
| 2021 | $1,636 | $17,139 | $2,760 | $14,379 |
| 2020 | $1,595 | $16,640 | $2,760 | $13,880 |
| 2019 | $1,549 | $16,183 | $2,760 | $13,423 |
| 2018 | $1,533 | $15,711 | $2,760 | $12,951 |
| 2017 | $1,516 | $15,711 | $2,760 | $12,951 |
| 2016 | $1,489 | $15,873 | $2,760 | $13,113 |
| 2015 | $1,501 | $14,976 | $2,760 | $12,216 |
| 2014 | $1,501 | $15,456 | $2,940 | $12,516 |
Source: Public Records
Map
Nearby Homes
- 513 N Shannon Way
- 313 N Shannon Way
- 400 N Amethyst Way
- 401 N Topaz Way
- 309 N Topaz Way
- 1035 W Windsor Way
- 1308 W Harvard Way
- 1316 W Harvard Way
- 609 N Centennial Way
- 1401 W Harvard Way
- 1208 W Flowering Peach Way
- 913 N Centennial Way
- 320 N Jasper Way
- 1425 W Harvard Way
- 508 N Caddell Way
- 608 N Remington Way
- 1005 W Ridgehaven Way
- 520 S Owen Dr
- 1250 N Tea Olive Way
- 601 N Chisholm Trail Way
- 1221 W Johnathan Way
- 1229 W Johnathan Way
- 1217 W Johnathan Way
- 1233 W Johnathan Way
- 1224 W Johnathan Way
- 1220 W Johnathan Way
- 1228 W Johnathan Way
- 1232 W Griggs Way
- 1216 W Johnathan Way
- 1213 W Johnathan Way
- 1228 W Griggs Way
- 1232 W Johnathan Way
- 1236 W Griggs Way
- 1212 W Johnathan Way
- 1209 W Johnathan Way
- 1220 W Griggs Way
- 1236 W Johnathan Way
- 1221 W Churchill Way
- 1208 W Johnathan Way
- 1225 W Churchill Way