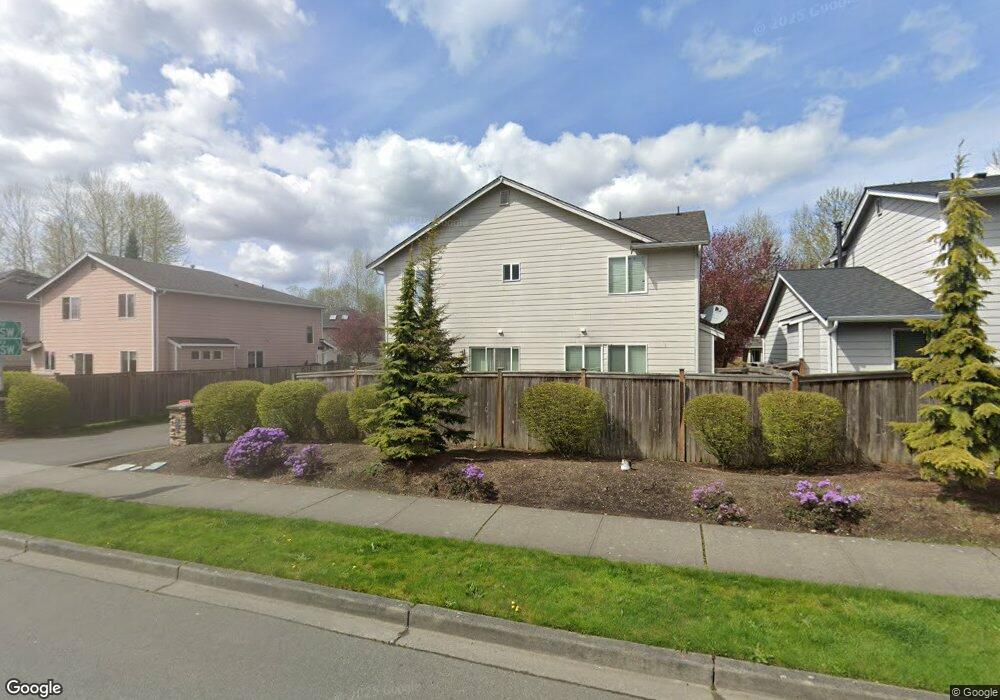
1226 149th St SW Unit 17 Lynnwood, WA 98087
Estimated Value: $730,000 - $762,000
4
Beds
3
Baths
1,825
Sq Ft
$408/Sq Ft
Est. Value
About This Home
This home is located at 1226 149th St SW Unit 17, Lynnwood, WA 98087 and is currently estimated at $745,177, approximately $408 per square foot. 1226 149th St SW Unit 17 is a home located in Snohomish County with nearby schools including Oak Heights Elementary School, Alderwood Middle School, and Lynnwood High School.
Ownership History
Date
Name
Owned For
Owner Type
Purchase Details
Closed on
Jul 26, 2020
Sold by
Beshahe Asfaw M and Tesfaye Abeba K
Bought by
Wamae Nyagah and Nyaga Margaret Wangare
Current Estimated Value
Home Financials for this Owner
Home Financials are based on the most recent Mortgage that was taken out on this home.
Original Mortgage
$475,000
Outstanding Balance
$422,136
Interest Rate
3.1%
Mortgage Type
New Conventional
Estimated Equity
$323,041
Purchase Details
Closed on
Jul 21, 2010
Sold by
Fagboye Monsurat
Bought by
Beshahe Asfaw M and Tesfaye Abeba K
Home Financials for this Owner
Home Financials are based on the most recent Mortgage that was taken out on this home.
Original Mortgage
$249,638
Interest Rate
4.5%
Mortgage Type
FHA
Purchase Details
Closed on
Jan 11, 2006
Sold by
Prh Llc
Bought by
Fagboye Monsurat
Home Financials for this Owner
Home Financials are based on the most recent Mortgage that was taken out on this home.
Original Mortgage
$267,880
Interest Rate
6.28%
Mortgage Type
Fannie Mae Freddie Mac
Create a Home Valuation Report for This Property
The Home Valuation Report is an in-depth analysis detailing your home's value as well as a comparison with similar homes in the area
Home Values in the Area
Average Home Value in this Area
Purchase History
| Date | Buyer | Sale Price | Title Company |
|---|---|---|---|
| Wamae Nyagah | $500,000 | Chicago Title | |
| Beshahe Asfaw M | $253,000 | Stewart | |
| Fagboye Monsurat | $334,850 | Pnwt |
Source: Public Records
Mortgage History
| Date | Status | Borrower | Loan Amount |
|---|---|---|---|
| Open | Wamae Nyagah | $475,000 | |
| Previous Owner | Beshahe Asfaw M | $249,638 | |
| Previous Owner | Fagboye Monsurat | $267,880 |
Source: Public Records
Tax History Compared to Growth
Tax History
| Year | Tax Paid | Tax Assessment Tax Assessment Total Assessment is a certain percentage of the fair market value that is determined by local assessors to be the total taxable value of land and additions on the property. | Land | Improvement |
|---|---|---|---|---|
| 2025 | $5,313 | $663,400 | $406,000 | $257,400 |
| 2024 | $5,313 | $638,400 | $381,000 | $257,400 |
| 2023 | $5,640 | $709,600 | $417,000 | $292,600 |
| 2022 | $5,266 | $539,300 | $288,000 | $251,300 |
| 2020 | $4,991 | $451,800 | $239,000 | $212,800 |
| 2019 | $4,709 | $424,100 | $211,000 | $213,100 |
| 2018 | $4,677 | $371,200 | $181,000 | $190,200 |
| 2017 | $4,053 | $332,700 | $155,000 | $177,700 |
| 2016 | $3,522 | $289,300 | $119,000 | $170,300 |
| 2015 | $3,452 | $269,400 | $104,000 | $165,400 |
| 2013 | $3,153 | $233,500 | $80,000 | $153,500 |
Source: Public Records
Map
Nearby Homes
- 15908 12th Place W
- 1532 145th Place SW Unit A
- 15110 13th Park W Unit 25
- 14424 Madison Way Unit E3
- 14424 Madison Way Unit G5
- 14424 Madison Way Unit E6
- 14424 Madison Way Unit E4
- 14424 Madison Way Unit G3
- 14424 Madison Way Unit G6
- 14424 Madison Way Unit G4
- 14424 Madison Way Unit G2
- 14424 Madison Way Unit G1
- Design 3 Plan at Bruntsfield Townhomes
- Design 2 Plan at Bruntsfield Townhomes
- Design 1 Plan at Bruntsfield Townhomes
- 14523 16th Park W Unit B
- 1328 152nd Place SW
- 14332 Madison Way
- 15404 Meadow Rd
- 1217 143rd St SW
- 1226 149th St SW
- 1222 149th St SW Unit 16
- 1308 149th St SW
- 1227 149th Place SW Unit 21
- 1313 149th Place SW Unit 19
- 1309 149th Place SW Unit 20
- 1225 149th St SW Unit 5
- 1229 149th St SW Unit 6
- 1229 149th St SW
- 1221 149th St SW Unit 4
- 1301 149th St SW Unit 7
- 1220 149th Place SW Unit 13
- 1220 149th Place SW
- 1201 149th St SW
- 1224 149th Place SW Unit 12
- 1217 149th St SW Unit 3
- 1305 149th St SW Unit 8
- 1205 149th St SW Unit 15
- 1230 149th Place SW Unit 11
- 1213 149th St SW Unit 2