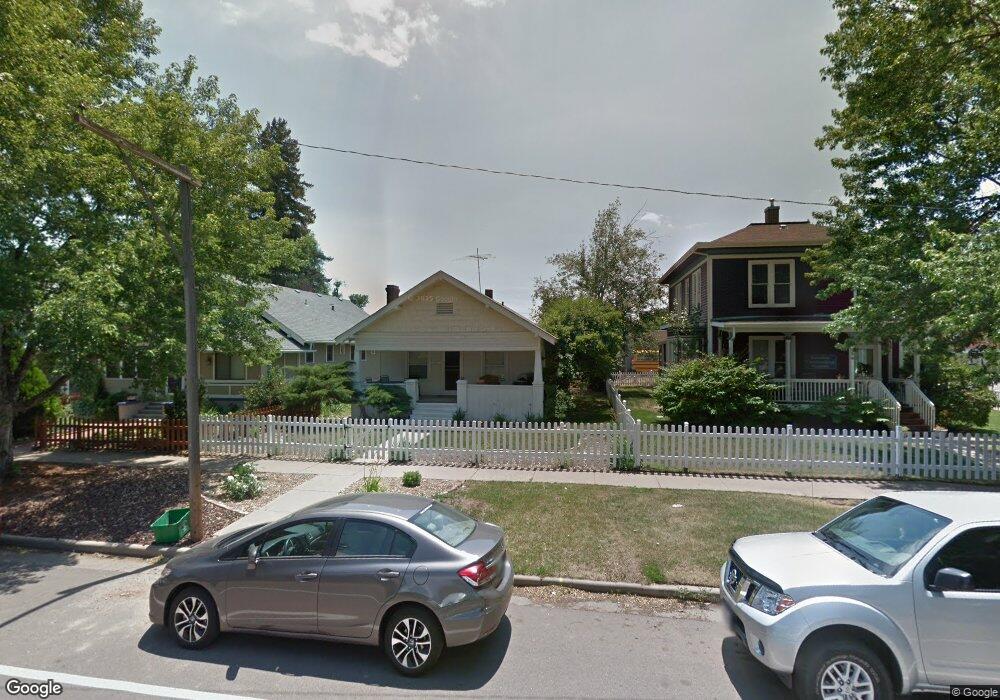
1226 8th St Greeley, CO 80631
City Center NeighborhoodEstimated Value: $288,000 - $301,000
2
Beds
1
Bath
999
Sq Ft
$297/Sq Ft
Est. Value
About This Home
This home is located at 1226 8th St, Greeley, CO 80631 and is currently estimated at $296,221, approximately $296 per square foot. 1226 8th St is a home located in Weld County with nearby schools including Martinez Elementary School, Franklin Middle School, and Northridge High School.
Ownership History
Date
Name
Owned For
Owner Type
Purchase Details
Closed on
Jan 27, 2018
Sold by
White Suzanne
Bought by
White David
Current Estimated Value
Home Financials for this Owner
Home Financials are based on the most recent Mortgage that was taken out on this home.
Original Mortgage
$87,550
Outstanding Balance
$49,224
Interest Rate
3.94%
Mortgage Type
New Conventional
Estimated Equity
$246,997
Purchase Details
Closed on
Aug 18, 2003
Sold by
White David and White Suzanne
Bought by
White David and White Suzanne
Purchase Details
Closed on
Jul 26, 2002
Sold by
Tavares Ellen M
Bought by
White David and White Suzanne
Home Financials for this Owner
Home Financials are based on the most recent Mortgage that was taken out on this home.
Original Mortgage
$108,059
Interest Rate
6.69%
Mortgage Type
FHA
Purchase Details
Closed on
Jan 7, 2000
Sold by
Lesser Freida H and Mae Ellen Mae
Bought by
Tavares Ellen M
Purchase Details
Closed on
Dec 1, 1983
Create a Home Valuation Report for This Property
The Home Valuation Report is an in-depth analysis detailing your home's value as well as a comparison with similar homes in the area
Home Values in the Area
Average Home Value in this Area
Purchase History
| Date | Buyer | Sale Price | Title Company |
|---|---|---|---|
| White David | -- | North American Title | |
| White David | -- | -- | |
| White David | $109,026 | -- | |
| Tavares Ellen M | -- | -- | |
| -- | -- | -- |
Source: Public Records
Mortgage History
| Date | Status | Borrower | Loan Amount |
|---|---|---|---|
| Open | White David | $87,550 | |
| Closed | White David | $108,059 |
Source: Public Records
Tax History
| Year | Tax Paid | Tax Assessment Tax Assessment Total Assessment is a certain percentage of the fair market value that is determined by local assessors to be the total taxable value of land and additions on the property. | Land | Improvement |
|---|---|---|---|---|
| 2025 | $1,361 | $18,190 | $2,160 | $16,030 |
| 2024 | $1,361 | $18,190 | $2,160 | $16,030 |
| 2023 | $1,298 | $19,920 | $2,340 | $17,580 |
| 2022 | $1,413 | $16,200 | $1,870 | $14,330 |
| 2021 | $1,458 | $16,670 | $1,930 | $14,740 |
| 2020 | $1,235 | $14,170 | $1,430 | $12,740 |
| 2019 | $1,238 | $14,170 | $1,430 | $12,740 |
| 2018 | $846 | $10,220 | $1,210 | $9,010 |
| 2017 | $851 | $10,220 | $1,210 | $9,010 |
| 2016 | $622 | $8,410 | $750 | $7,660 |
| 2015 | $620 | $8,410 | $750 | $7,660 |
| 2014 | $401 | $5,310 | $660 | $4,650 |
Source: Public Records
Map
Nearby Homes
Your Personal Tour Guide
Ask me questions while you tour the home.