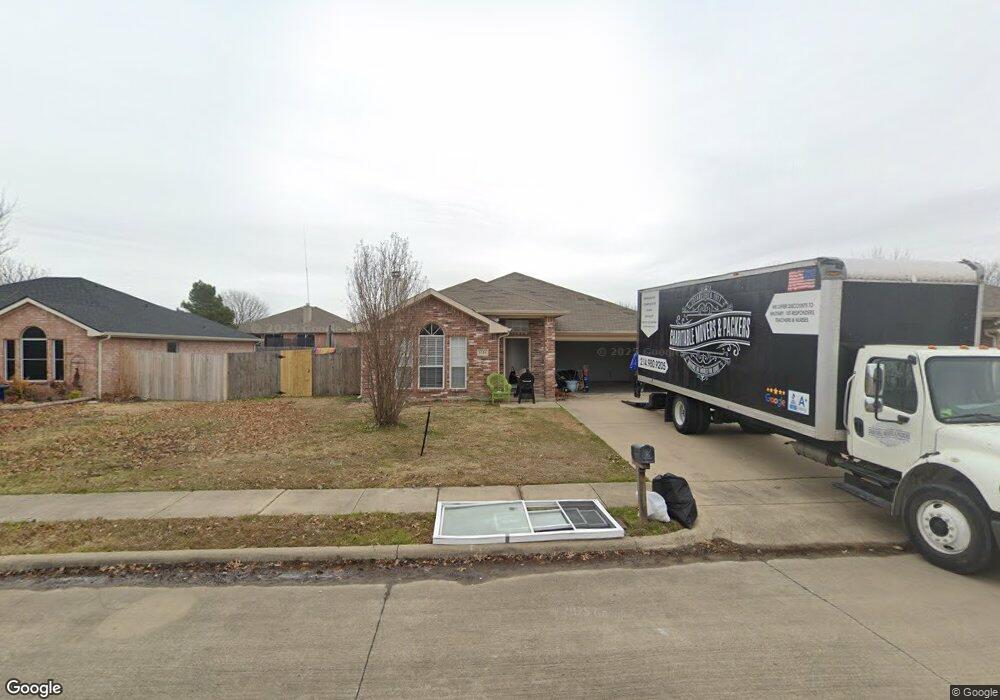
1226 Embercrest Dr Midlothian, TX 76065
Estimated Value: $287,766 - $299,000
3
Beds
2
Baths
1,313
Sq Ft
$223/Sq Ft
Est. Value
About This Home
This home is located at 1226 Embercrest Dr, Midlothian, TX 76065 and is currently estimated at $293,383, approximately $223 per square foot. 1226 Embercrest Dr is a home located in Ellis County with nearby schools including J A Vitovsky Elementary School and Walnut Grove Middle School.
Ownership History
Date
Name
Owned For
Owner Type
Purchase Details
Closed on
Aug 26, 2014
Sold by
American Residential Leasing Co Llc
Bought by
Arp 2014 1 Borrower Llc
Current Estimated Value
Home Financials for this Owner
Home Financials are based on the most recent Mortgage that was taken out on this home.
Original Mortgage
$342,241,000
Outstanding Balance
$262,104,744
Interest Rate
4.15%
Mortgage Type
Purchase Money Mortgage
Estimated Equity
-$261,811,361
Purchase Details
Closed on
Jun 3, 2013
Sold by
Suydam Andrew L and Suydam Roben R
Bought by
American Residential Leasing Company Llc
Purchase Details
Closed on
Dec 28, 2007
Sold by
Burgess Adam D and Burgess Kimberly B
Bought by
Suydam Andrew and Suydam Roben R
Home Financials for this Owner
Home Financials are based on the most recent Mortgage that was taken out on this home.
Original Mortgage
$115,869
Interest Rate
6.23%
Mortgage Type
New Conventional
Create a Home Valuation Report for This Property
The Home Valuation Report is an in-depth analysis detailing your home's value as well as a comparison with similar homes in the area
Home Values in the Area
Average Home Value in this Area
Purchase History
| Date | Buyer | Sale Price | Title Company |
|---|---|---|---|
| Arp 2014 1 Borrower Llc | -- | None Available | |
| American Residential Leasing Company Llc | -- | Alamo Title Co | |
| Suydam Andrew | -- | -- |
Source: Public Records
Mortgage History
| Date | Status | Borrower | Loan Amount |
|---|---|---|---|
| Open | Arp 2014 1 Borrower Llc | $342,241,000 | |
| Previous Owner | Suydam Andrew | $115,869 |
Source: Public Records
Tax History
| Year | Tax Paid | Tax Assessment Tax Assessment Total Assessment is a certain percentage of the fair market value that is determined by local assessors to be the total taxable value of land and additions on the property. | Land | Improvement |
|---|---|---|---|---|
| 2025 | $5,387 | $260,448 | $80,000 | $180,448 |
| 2024 | $5,387 | $266,987 | $80,000 | $186,987 |
| 2023 | $5,387 | $290,857 | $70,000 | $220,857 |
| 2022 | $5,409 | $241,444 | $50,000 | $191,444 |
| 2021 | $4,733 | $200,000 | $35,000 | $165,000 |
| 2020 | $4,937 | $196,250 | $35,000 | $161,250 |
| 2019 | $4,954 | $189,168 | $0 | $0 |
| 2017 | $4,033 | $151,500 | $25,000 | $126,500 |
| 2016 | $3,719 | $139,700 | $20,000 | $119,700 |
Source: Public Records
Map
Nearby Homes
- 1410 Embercrest Dr
- 1305 Misty Meadow Dr
- 1214 Misty Meadow Dr
- TBD 1 acre Overlook Dr
- 606 Overlook Dr
- 0 U S Highway 67
- 807 Crockett St
- 902 W Avenue D
- 620 N 6th St
- 900 W Avenue F
- 1834 Rough Ridge Trail
- 4418 Timberdrift St
- 000 N 6th St
- 4434 Verbena St
- 215 S 1st St
- 120 N 5th St
- 1015 Magdalena Way
- 809 Deleon Dr
- 316 S 5th St
- 107 Sewell Ave
- 1302 Embercrest Dr
- 1222 Embercrest Dr
- 1217 Rye Glen Dr
- 1218 Embercrest Dr
- 1306 Embercrest Dr
- 1213 Rye Glen Dr
- 1225 Embercrest Dr
- 1301 Embercrest Dr
- 1209 Rye Glen Dr
- 1221 Embercrest Dr
- 1214 Embercrest Dr
- 1310 Embercrest Dr
- 1305 Embercrest Dr
- 1217 Embercrest Dr
- 1309 Rye Glen Dr
- 1205 Rye Glen Dr
- 1314 Embercrest Dr
- 1210 Embercrest Dr
- 1213 Embercrest Dr
- 1302 Beacon Hill Dr
Your Personal Tour Guide
Ask me questions while you tour the home.