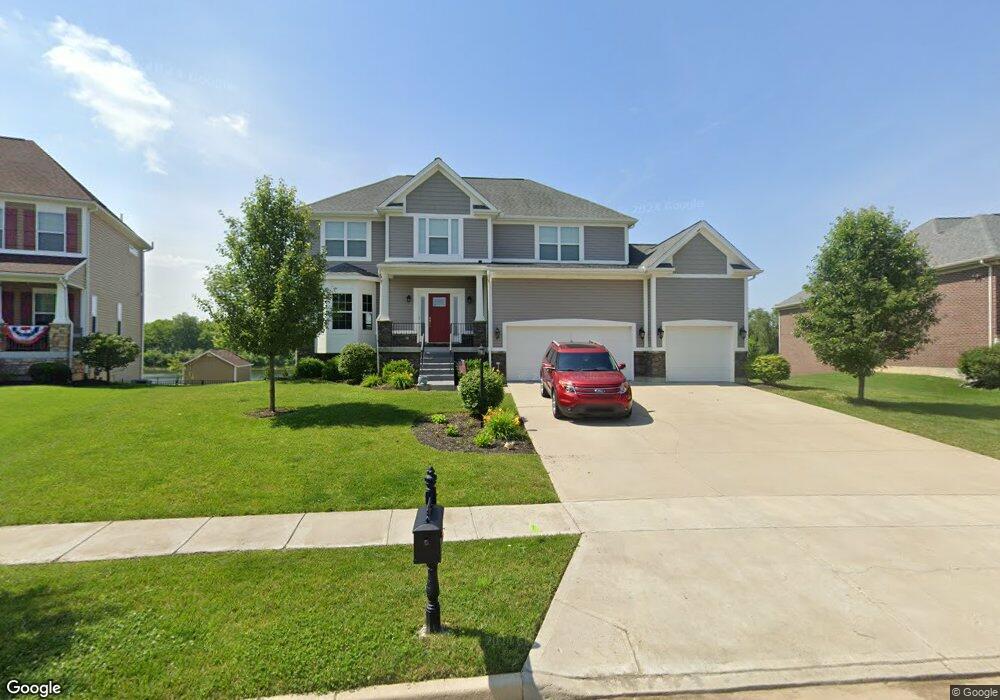
1226 Freedom Point Beavercreek, OH 45434
Estimated Value: $565,000 - $648,000
5
Beds
4
Baths
4,884
Sq Ft
$122/Sq Ft
Est. Value
About This Home
This home is located at 1226 Freedom Point, Beavercreek, OH 45434 and is currently estimated at $597,079, approximately $122 per square foot. 1226 Freedom Point is a home located in Greene County with nearby schools including Trebein Elementary School, Jacob Coy Middle School, and Beavercreek High School.
Ownership History
Date
Name
Owned For
Owner Type
Purchase Details
Closed on
May 26, 2020
Sold by
King Jeffrey J and Vansant Christina J
Bought by
Bennett Richard and Bennett Kayla
Current Estimated Value
Home Financials for this Owner
Home Financials are based on the most recent Mortgage that was taken out on this home.
Original Mortgage
$360,000
Outstanding Balance
$319,112
Interest Rate
3.2%
Mortgage Type
New Conventional
Estimated Equity
$277,967
Purchase Details
Closed on
Mar 31, 2015
Sold by
M L Huddleston Construction Co Inc
Bought by
King Jeffrey J and Vansant Christina J
Home Financials for this Owner
Home Financials are based on the most recent Mortgage that was taken out on this home.
Original Mortgage
$267,988
Interest Rate
3.73%
Mortgage Type
New Conventional
Create a Home Valuation Report for This Property
The Home Valuation Report is an in-depth analysis detailing your home's value as well as a comparison with similar homes in the area
Home Values in the Area
Average Home Value in this Area
Purchase History
| Date | Buyer | Sale Price | Title Company |
|---|---|---|---|
| Bennett Richard | $450,000 | Vantage Land Title | |
| King Jeffrey J | $335,000 | Landmark Title Agency Inc | |
| M L Huddleston Construction Co Inc | -- | None Available |
Source: Public Records
Mortgage History
| Date | Status | Borrower | Loan Amount |
|---|---|---|---|
| Open | Bennett Richard | $360,000 | |
| Previous Owner | King Jeffrey J | $267,988 |
Source: Public Records
Tax History Compared to Growth
Tax History
| Year | Tax Paid | Tax Assessment Tax Assessment Total Assessment is a certain percentage of the fair market value that is determined by local assessors to be the total taxable value of land and additions on the property. | Land | Improvement |
|---|---|---|---|---|
| 2024 | $11,117 | $166,970 | $31,070 | $135,900 |
| 2023 | $11,117 | $166,970 | $31,070 | $135,900 |
| 2022 | $10,003 | $132,610 | $23,900 | $108,710 |
| 2021 | $9,806 | $121,870 | $23,900 | $97,970 |
| 2020 | $9,080 | $121,870 | $23,900 | $97,970 |
| 2019 | $9,936 | $121,760 | $26,350 | $95,410 |
| 2018 | $8,794 | $121,760 | $26,350 | $95,410 |
| 2017 | $8,985 | $121,760 | $26,350 | $95,410 |
| 2016 | $8,986 | $120,490 | $26,350 | $94,140 |
| 2015 | $1,148 | $15,480 | $15,480 | $0 |
| 2014 | $1,131 | $15,480 | $15,480 | $0 |
Source: Public Records
Map
Nearby Homes
- 1238 Freedom Point
- 1360 Backridge Ct
- 2073 Lincolnshire Dr
- 1535 Stretch Dr
- 2245 Tourney Trail
- 887 Shady Ln
- 1361 Obetz Dr Unit A
- 1394 Crown Point Ct
- 895 Alpha Rd
- 2154 Sulky Trail
- 1156 Westover Rd
- 2331 Eastwind Dr
- 2162 Sulky Trail
- 1590 Windham Ln
- 1051 Forest Dr
- 1210 Lomeda Ln
- 1589 Stonebury Ct
- 1023 Amersham Ave
- 2507 Obetz Dr
- 2162 Owen E
- 1230 Freedom Point
- 1222 Freedom Point
- 1234 Freedom Point
- 1235 Freedom Point
- 2087 Marchfield Way
- 1253 Freedom Point
- 1244 Freedom Point
- 1242 Patriot Way
- 2102 Marchfield Way
- 1252 Freedom Point
- 1239 Patriot Way
- 1261 Freedom Point
- 1246 Patriot Way
- 1256 Freedom Point
- 2110 Marchfield Way
- 1250 Patriot Way
- 1265 Freedom Point
- 1243 Patriot Way
- 1264 Freedom Pointe
- 2118 Marchfield Way