Estimated Value: $61,000 - $92,000
2
Beds
1
Bath
888
Sq Ft
$87/Sq Ft
Est. Value
About This Home
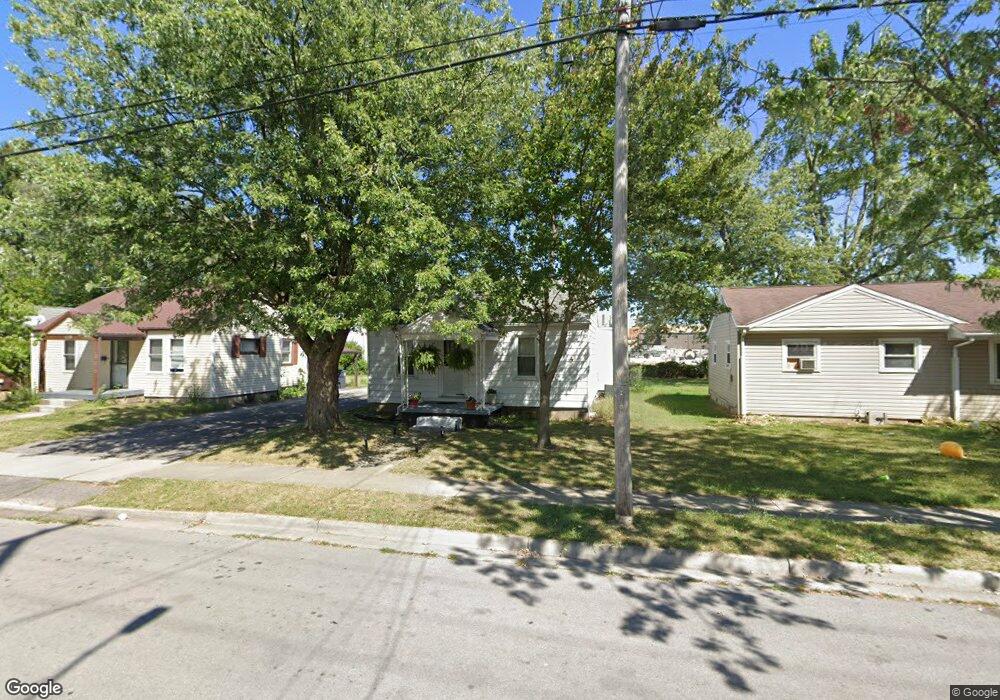
This home is located at 1226 N Union St, Lima, OH 45801 and is currently estimated at $77,004, approximately $86 per square foot. 1226 N Union St is a home located in Allen County with nearby schools including Independence Elementary School, Lima North Middle School, and Lima West Middle School.
Ownership History
Date
Name
Owned For
Owner Type
Purchase Details
Closed on
Feb 1, 2018
Sold by
Warnecke James L and Warnecke Suzanne M
Bought by
J & S Warnecke Rentals Llc
Current Estimated Value
Home Financials for this Owner
Home Financials are based on the most recent Mortgage that was taken out on this home.
Original Mortgage
$89,800
Outstanding Balance
$76,052
Interest Rate
3.99%
Mortgage Type
Future Advance Clause Open End Mortgage
Estimated Equity
$952
Purchase Details
Closed on
Feb 16, 2011
Sold by
Fiser Richard F
Bought by
Warnecke James L and Warnecke Suzanne M
Home Financials for this Owner
Home Financials are based on the most recent Mortgage that was taken out on this home.
Original Mortgage
$53,500
Interest Rate
4.85%
Mortgage Type
Future Advance Clause Open End Mortgage
Purchase Details
Closed on
May 28, 1986
Bought by
Fiser Edith
Create a Home Valuation Report for This Property
The Home Valuation Report is an in-depth analysis detailing your home's value as well as a comparison with similar homes in the area
Purchase History
| Date | Buyer | Sale Price | Title Company |
|---|---|---|---|
| J & S Warnecke Rentals Llc | -- | None Available | |
| Warnecke James L | $29,500 | Attorney | |
| Fiser Edith | -- | -- |
Source: Public Records
Mortgage History
| Date | Status | Borrower | Loan Amount |
|---|---|---|---|
| Open | J & S Warnecke Rentals Llc | $89,800 | |
| Previous Owner | Warnecke James L | $53,500 |
Source: Public Records
Tax History
| Year | Tax Paid | Tax Assessment Tax Assessment Total Assessment is a certain percentage of the fair market value that is determined by local assessors to be the total taxable value of land and additions on the property. | Land | Improvement |
|---|---|---|---|---|
| 2024 | $650 | $16,420 | $2,630 | $13,790 |
| 2023 | $600 | $12,920 | $2,070 | $10,850 |
| 2022 | $596 | $12,920 | $2,070 | $10,850 |
| 2021 | $630 | $12,920 | $2,070 | $10,850 |
| 2020 | $595 | $10,790 | $2,000 | $8,790 |
| 2019 | $595 | $10,790 | $2,000 | $8,790 |
| 2018 | $598 | $10,790 | $2,000 | $8,790 |
| 2017 | $597 | $10,790 | $2,000 | $8,790 |
| 2016 | $604 | $10,790 | $2,000 | $8,790 |
| 2015 | $633 | $10,790 | $2,000 | $8,790 |
| 2014 | $633 | $11,340 | $1,960 | $9,380 |
| 2013 | $617 | $11,340 | $1,960 | $9,380 |
Source: Public Records
Map
Nearby Homes
- 1435 N Central Ave
- 919 N Main St
- 207 W Lane Ave
- 712 Taylor Ave
- 922 N Jefferson St
- 1021 N McDonel St
- 735 N Elizabeth St
- 316 Ewing Ave
- 928 Burch Ave
- 576 W Ashton Ave
- 557 W Ashton Ave
- 406 Ewing Ave
- 1809 N Metcalf St
- 1212 Virginia Ave
- 645 W O'Connor Ave
- 635 W Ashton Ave
- 934 N Metcalf St
- 500 W Northern Ave
- 616-616.5 N Elizabeth St
- 1705 Karen St
- 1228 N Union St
- 1230 N Union St
- 1229 N Central Ave
- 1232 N Union St
- 1227 N Union St
- 1231 N Union St
- 1234 N Union St
- 1225 N Union St
- 1233 N Union St
- 240 E Robb Ave
- 1236 N Union St
- 1217 N Union St
- 209 E Oconnor Ave
- 203 E Oconnor Ave
- 203 E Oconnor Ave
- 1177 N Central Ave
- 1213 N Union St
- 1237 N Union St
- 215 E Oconnor Ave
Your Personal Tour Guide
Ask me questions while you tour the home.