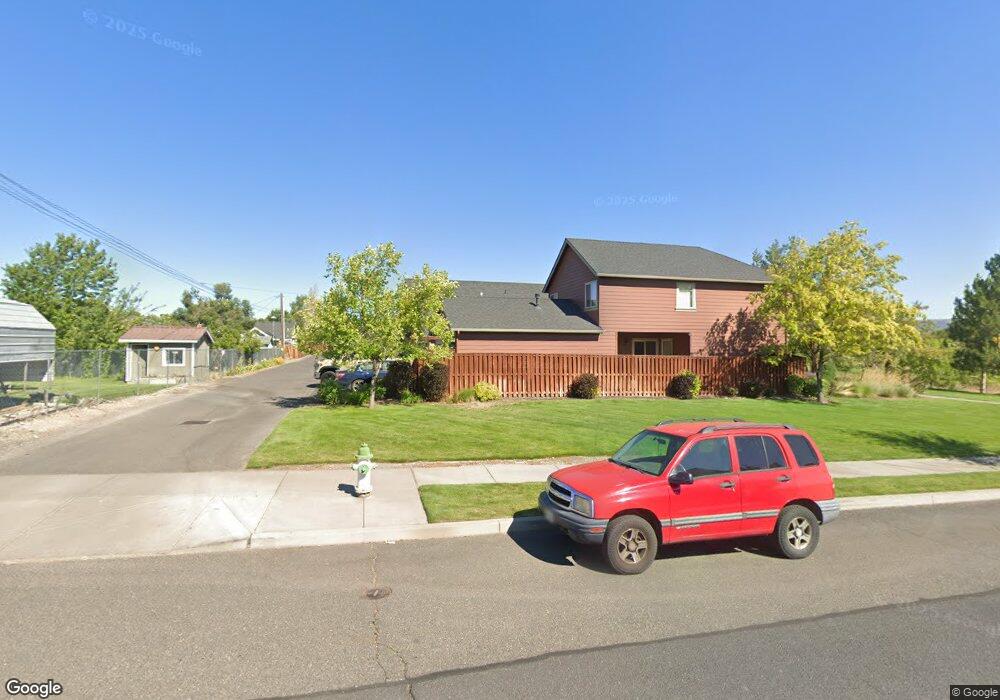
1226 NE Littleton Ln Prineville, OR 97754
Estimated Value: $330,236 - $384,000
2
Beds
2
Baths
1,041
Sq Ft
$343/Sq Ft
Est. Value
About This Home
This home is located at 1226 NE Littleton Ln, Prineville, OR 97754 and is currently estimated at $357,118, approximately $343 per square foot. 1226 NE Littleton Ln is a home located in Crook County with nearby schools including Crooked River Elementary School, Crook County Middle School, and Crook County High School.
Ownership History
Date
Name
Owned For
Owner Type
Purchase Details
Closed on
Aug 17, 2017
Sold by
Weston Carol M
Bought by
Lynch John S
Current Estimated Value
Purchase Details
Closed on
May 6, 2014
Sold by
Priday Courtney R
Bought by
Weston Carol M
Purchase Details
Closed on
Feb 3, 2014
Sold by
Priday Rory R
Bought by
Priday Courtney R
Purchase Details
Closed on
Dec 29, 2005
Sold by
Elk Horn Development Llc
Bought by
Pablisch Homes Inc
Home Financials for this Owner
Home Financials are based on the most recent Mortgage that was taken out on this home.
Original Mortgage
$120,000
Interest Rate
5.5%
Mortgage Type
Adjustable Rate Mortgage/ARM
Purchase Details
Closed on
Dec 28, 2005
Sold by
Pahlisch Home Inc
Bought by
Priday Rory R
Home Financials for this Owner
Home Financials are based on the most recent Mortgage that was taken out on this home.
Original Mortgage
$120,000
Interest Rate
5.5%
Mortgage Type
Adjustable Rate Mortgage/ARM
Create a Home Valuation Report for This Property
The Home Valuation Report is an in-depth analysis detailing your home's value as well as a comparison with similar homes in the area
Home Values in the Area
Average Home Value in this Area
Purchase History
| Date | Buyer | Sale Price | Title Company |
|---|---|---|---|
| Lynch John S | $257,000 | Western Title & Escrow Co | |
| Weston Carol M | $128,000 | Western Title & Escrow | |
| Priday Courtney R | $133,581 | Accommodation | |
| Pablisch Homes Inc | $35,000 | Amerititle | |
| Priday Rory R | -- | Amerititle |
Source: Public Records
Mortgage History
| Date | Status | Borrower | Loan Amount |
|---|---|---|---|
| Previous Owner | Priday Rory R | $120,000 |
Source: Public Records
Tax History Compared to Growth
Tax History
| Year | Tax Paid | Tax Assessment Tax Assessment Total Assessment is a certain percentage of the fair market value that is determined by local assessors to be the total taxable value of land and additions on the property. | Land | Improvement |
|---|---|---|---|---|
| 2024 | $2,348 | $145,620 | -- | -- |
| 2023 | $2,268 | $141,380 | $0 | $0 |
| 2022 | $2,198 | $137,270 | $0 | $0 |
| 2021 | $2,186 | $133,280 | $0 | $0 |
| 2020 | $2,126 | $129,401 | $0 | $0 |
| 2019 | $2,053 | $121,973 | $0 | $0 |
| 2018 | $1,998 | $121,973 | $0 | $0 |
| 2017 | $1,965 | $118,420 | $0 | $0 |
| 2016 | $1,879 | $111,622 | $0 | $0 |
| 2015 | $1,800 | $111,622 | $0 | $0 |
| 2013 | -- | $105,215 | $0 | $0 |
Source: Public Records
Map
Nearby Homes
- 1288 NE Littleton Ln
- 999 NE Del Rio Ave
- 871 NE Whistle Way
- 701 NE Union Loop
- 1214 NE Loper Ave
- 745 NE Union Loop
- 810 NE Crest Dr
- 1459 NE Whistle Way
- 1477 NE Whistle Way
- 1445 NE Whistle Way
- 1403 NE Whistle Way
- 1437 NE Whistle Way
- 1425 NE Whistle Way
- 1371 NE Whistle Way
- 1438 NE Whistle Way
- 1472 NE Whistle Way
- 1404 NE Whistle Way
- 1428 NE Whistle Way
- 1416 NE Whistle Way
- 1314 NE Whistle Way
- 1238 NE Littleton Ln
- 1214 NE Littleton Ln
- 1240 NE Littleton Ln
- 1252 NE Littleton Ln
- 1296 NE Ochoco Ave
- 1294 NE Ochoco Ave
- 1264 NE Littleton Ln
- 1276 NE Littleton Ln
- 1130 NE Allen Ave
- 1292 NE Ochoco Ave
- 1290 NE Littleton Ln
- 1390 NE Ochoco Ave
- 1120 NE Allen Ave
- 1302 NE Littleton Ln
- 1365 NE Ochoco Ave
- 1314 NE Littleton Ln
- 1375 NE Ochoco Ave
- 985 NE Crest Dr
- 1392 NE Ochoco Ave Unit lot11
- 1392 NE Ochoco Ave