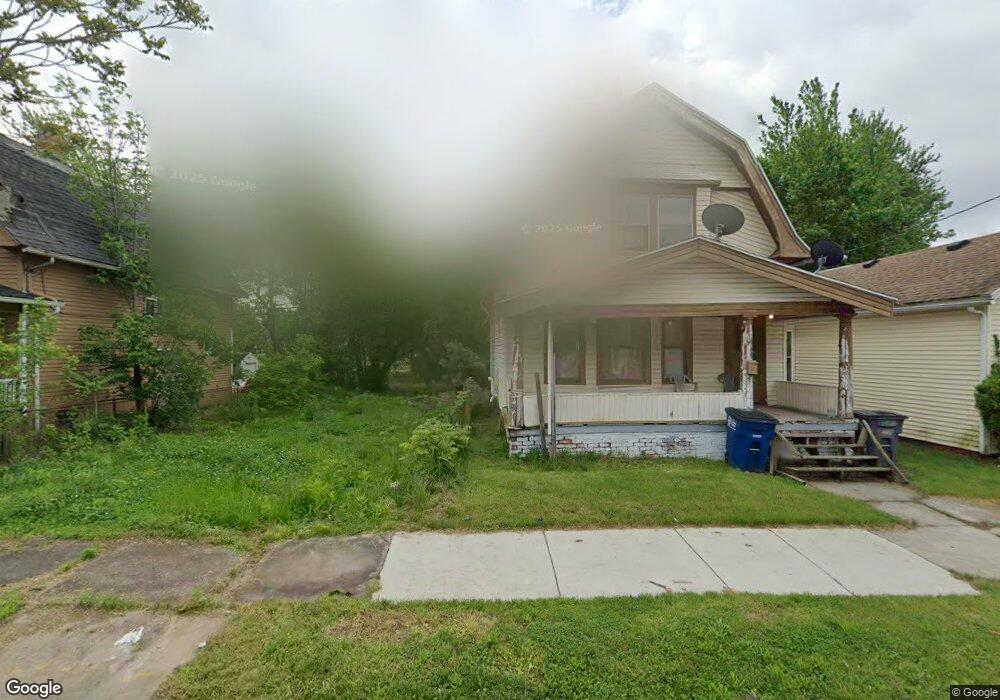
1226 Peck St Toledo, OH 43608
Lagrange NeighborhoodEstimated Value: $96,000
4
Beds
1
Bath
1,160
Sq Ft
$83/Sq Ft
Est. Value
About This Home
This home is located at 1226 Peck St, Toledo, OH 43608 and is currently estimated at $96,000, approximately $82 per square foot. 1226 Peck St is a home located in Lucas County with nearby schools including Spring Elementary School, Woodward High School, and Imagine Environmental Science Academy.
Ownership History
Date
Name
Owned For
Owner Type
Purchase Details
Closed on
Aug 1, 2013
Sold by
Peters Derrick and Bartholomew Tisa
Bought by
Heidt April
Current Estimated Value
Purchase Details
Closed on
Jun 24, 2013
Sold by
Alsarray Muayad
Bought by
Peters Derrick and Bartholomew Tisa
Purchase Details
Closed on
Feb 4, 2005
Sold by
Al Gharib Ali
Bought by
Alsarray Muayad
Purchase Details
Closed on
Jul 24, 1996
Sold by
Ransey Linda L
Bought by
Ransey Masheba A and Ransey Clinton
Home Financials for this Owner
Home Financials are based on the most recent Mortgage that was taken out on this home.
Original Mortgage
$17,250
Interest Rate
8.43%
Mortgage Type
New Conventional
Create a Home Valuation Report for This Property
The Home Valuation Report is an in-depth analysis detailing your home's value as well as a comparison with similar homes in the area
Home Values in the Area
Average Home Value in this Area
Purchase History
| Date | Buyer | Sale Price | Title Company |
|---|---|---|---|
| Heidt April | $300 | None Available | |
| Peters Derrick | $500 | None Available | |
| Alsarray Muayad | $1,000 | -- | |
| Ransey Masheba A | $12,000 | -- |
Source: Public Records
Mortgage History
| Date | Status | Borrower | Loan Amount |
|---|---|---|---|
| Previous Owner | Ransey Masheba A | $17,250 |
Source: Public Records
Tax History Compared to Growth
Tax History
| Year | Tax Paid | Tax Assessment Tax Assessment Total Assessment is a certain percentage of the fair market value that is determined by local assessors to be the total taxable value of land and additions on the property. | Land | Improvement |
|---|---|---|---|---|
| 2024 | $33,758 | $175 | $175 | -- |
| 2023 | $240 | $140 | $140 | $0 |
| 2022 | $166 | $140 | $140 | $0 |
| 2021 | $155 | $140 | $140 | $0 |
| 2020 | $159 | $105 | $105 | $0 |
| 2019 | $567 | $5,950 | $1,400 | $4,550 |
| 2018 | $1,306 | $5,950 | $1,400 | $4,550 |
| 2017 | $12,825 | $5,810 | $1,365 | $4,445 |
| 2016 | $10,864 | $16,600 | $3,900 | $12,700 |
| 2015 | $559 | $16,600 | $3,900 | $12,700 |
| 2014 | $549 | $5,820 | $1,370 | $4,450 |
| 2013 | $366 | $5,820 | $1,370 | $4,450 |
Source: Public Records
Map
Nearby Homes