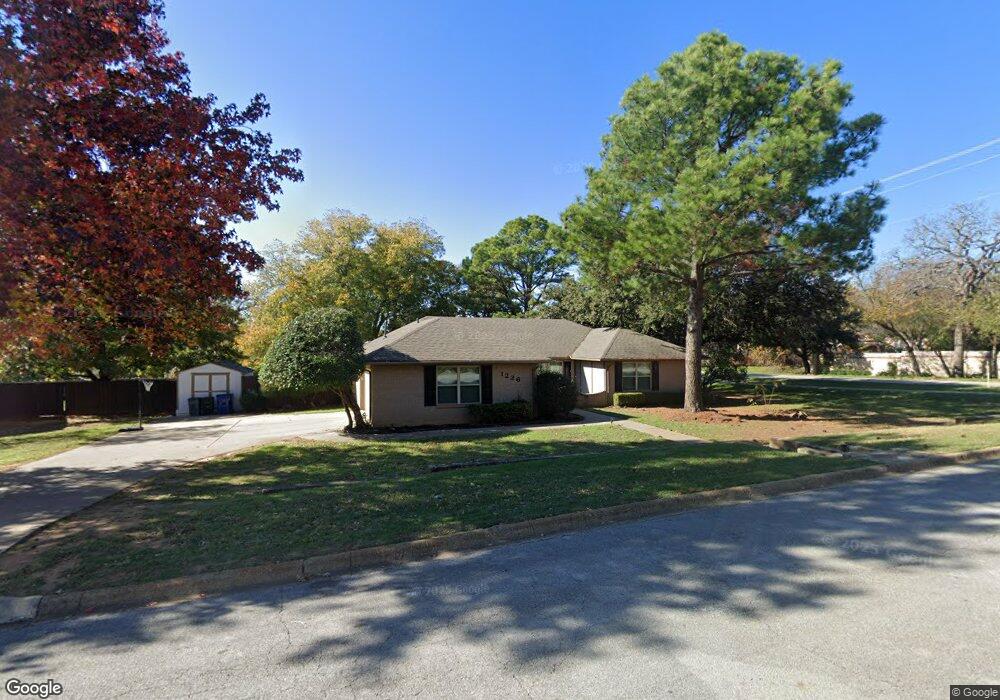
1226 Ridgewood Cir Southlake, TX 76092
Estimated Value: $709,410 - $743,000
4
Beds
2
Baths
2,030
Sq Ft
$358/Sq Ft
Est. Value
About This Home
This home is located at 1226 Ridgewood Cir, Southlake, TX 76092 and is currently estimated at $725,853, approximately $357 per square foot. 1226 Ridgewood Cir is a home located in Tarrant County with nearby schools including Carroll Elementary School, Eubanks Intermediate School, and George Dawson Middle School.
Ownership History
Date
Name
Owned For
Owner Type
Purchase Details
Closed on
Jul 29, 2003
Sold by
Mickens Ray and Mickens Sherri
Bought by
Mickens Inc
Current Estimated Value
Purchase Details
Closed on
Jan 15, 2003
Sold by
Federal National Mortgage Association
Bought by
Mickens Ray and Mickens Sherri
Purchase Details
Closed on
Oct 24, 2002
Sold by
Washington Mutual Bank Fa
Bought by
Federal National Mortgage Association
Purchase Details
Closed on
Oct 1, 2002
Sold by
Mcnair Scott L and Mcnair Meredith
Bought by
Washington Mutual Bank Fa and North American Mtg Company
Purchase Details
Closed on
Sep 21, 2000
Sold by
Polak Joseph J and Polak Patricia M
Bought by
Mcnair Scott L and Mcnair Meredith
Home Financials for this Owner
Home Financials are based on the most recent Mortgage that was taken out on this home.
Original Mortgage
$156,750
Interest Rate
8.01%
Create a Home Valuation Report for This Property
The Home Valuation Report is an in-depth analysis detailing your home's value as well as a comparison with similar homes in the area
Home Values in the Area
Average Home Value in this Area
Purchase History
| Date | Buyer | Sale Price | Title Company |
|---|---|---|---|
| Mickens Inc | -- | North American Title | |
| Mickens Ray | -- | Stewart Title | |
| Federal National Mortgage Association | -- | -- | |
| Washington Mutual Bank Fa | $136,685 | -- | |
| Mcnair Scott L | -- | Southwest Land Title |
Source: Public Records
Mortgage History
| Date | Status | Borrower | Loan Amount |
|---|---|---|---|
| Previous Owner | Mcnair Scott L | $156,750 |
Source: Public Records
Tax History Compared to Growth
Tax History
| Year | Tax Paid | Tax Assessment Tax Assessment Total Assessment is a certain percentage of the fair market value that is determined by local assessors to be the total taxable value of land and additions on the property. | Land | Improvement |
|---|---|---|---|---|
| 2025 | $10,552 | $482,000 | $295,275 | $186,725 |
| 2024 | $10,552 | $603,295 | $295,275 | $308,020 |
| 2023 | $10,207 | $560,000 | $295,275 | $264,725 |
| 2022 | $11,220 | $520,071 | $196,850 | $323,221 |
| 2021 | $7,752 | $340,000 | $196,850 | $143,150 |
| 2020 | $8,253 | $359,030 | $177,165 | $181,865 |
| 2019 | $8,700 | $359,294 | $177,165 | $182,129 |
| 2018 | $8,828 | $364,549 | $177,165 | $187,384 |
| 2017 | $7,808 | $315,000 | $98,425 | $216,575 |
| 2016 | $7,793 | $314,393 | $98,425 | $215,968 |
| 2015 | $6,133 | $245,000 | $55,000 | $190,000 |
| 2014 | $6,133 | $245,000 | $55,000 | $190,000 |
Source: Public Records
Map
Nearby Homes
- 1206 Oakwood Trail
- 1212 Oakwood Trail
- 1196 W Continental Blvd
- 1002 Chimney Hill Trail
- 1205 Scenic Dr
- 7702 Tillman Hill Rd
- 900 Kingsbury Way
- 7511 Mount Vernon Dr
- 7607 Monticello Pkwy
- 945 Deer Hollow Blvd
- 1010 Deer Hollow Blvd
- 1904 Cresson Dr
- 608 Stratford Dr
- 3325 Creek Rd
- 690 S Peytonville Ave
- 710 Deer Hollow Blvd
- 7400 John Mccain Rd
- 512 Bandit Trail
- 510 Bandit Trail
- 802 Princeton Ct
- 1224 Ridgewood Cir
- 1201 Oakwood Trail
- 1203 Oakwood Trail
- 1225 Ridgewood Cir
- 1222 Ridgewood Cir
- 1223 Ridgewood Cir
- 1011 Southlake Hills Dr
- 1205 Oakwood Trail
- 1221 Ridgewood Cir
- 1009 Southlake Hills Dr
- 1220 Ridgewood Cir
- 1219 Ridgewood Cir
- 1207 Oakwood Trail
- 1228 W Continental Blvd
- 1202 Ridgewood Cir
- 1204 Ridgewood Cir
- 1202 Oakwood Trail
- 1204 Oakwood Trail
- 1010 Southlake Hills Dr
- 1206 Ridgewood Cir