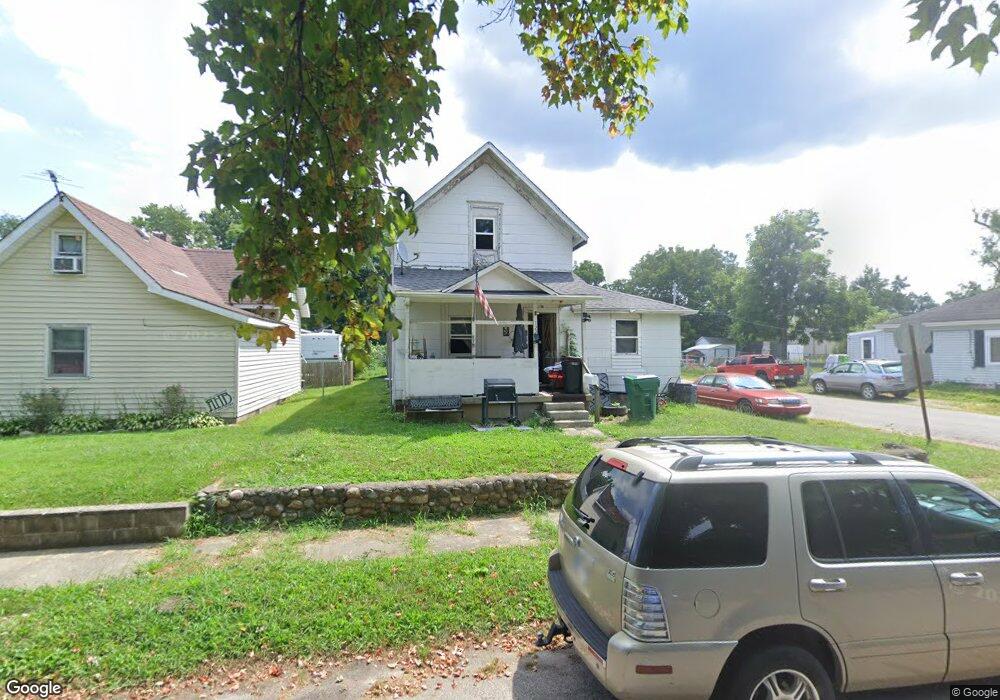
1226 S 19th St New Castle, IN 47362
Estimated Value: $50,000 - $128,000
3
Beds
1
Bath
1,330
Sq Ft
$60/Sq Ft
Est. Value
About This Home
This home is located at 1226 S 19th St, New Castle, IN 47362 and is currently estimated at $80,077, approximately $60 per square foot. 1226 S 19th St is a home located in Henry County with nearby schools including Agape Learning Center.
Ownership History
Date
Name
Owned For
Owner Type
Purchase Details
Closed on
Jul 13, 2021
Sold by
Thousand Kleys Acquistions 2B Llc
Bought by
Smith David M
Current Estimated Value
Home Financials for this Owner
Home Financials are based on the most recent Mortgage that was taken out on this home.
Original Mortgage
$28,200
Outstanding Balance
$21,576
Interest Rate
2.96%
Mortgage Type
New Conventional
Estimated Equity
$58,501
Purchase Details
Closed on
Apr 13, 2021
Sold by
Wells Fargo Bank National Association
Bought by
Thousand Keys Acquisitions 2B Llc
Purchase Details
Closed on
Sep 3, 2020
Sold by
Rees Marty and Rees Mitzi Jo
Bought by
Wells Fargo Bank National Association and Park Place Securities Inc
Create a Home Valuation Report for This Property
The Home Valuation Report is an in-depth analysis detailing your home's value as well as a comparison with similar homes in the area
Home Values in the Area
Average Home Value in this Area
Purchase History
| Date | Buyer | Sale Price | Title Company |
|---|---|---|---|
| Smith David M | $29,900 | Boston National Ttl Agcy Llc | |
| Thousand Keys Acquisitions 2B Llc | $4,800 | None Available | |
| Wells Fargo Bank National Association | $10,800 | None Available |
Source: Public Records
Mortgage History
| Date | Status | Borrower | Loan Amount |
|---|---|---|---|
| Open | Smith David M | $28,200 |
Source: Public Records
Tax History Compared to Growth
Tax History
| Year | Tax Paid | Tax Assessment Tax Assessment Total Assessment is a certain percentage of the fair market value that is determined by local assessors to be the total taxable value of land and additions on the property. | Land | Improvement |
|---|---|---|---|---|
| 2024 | $424 | $46,600 | $9,400 | $37,200 |
| 2023 | $378 | $42,300 | $9,400 | $32,900 |
| 2022 | $356 | $35,600 | $6,300 | $29,300 |
| 2021 | $313 | $31,300 | $6,300 | $25,000 |
| 2020 | $627 | $30,100 | $6,300 | $23,800 |
| 2019 | $235 | $29,200 | $6,300 | $22,900 |
| 2018 | $184 | $27,900 | $5,700 | $22,200 |
| 2017 | $197 | $27,600 | $5,700 | $21,900 |
| 2016 | $216 | $32,500 | $6,700 | $25,800 |
| 2014 | $181 | $34,100 | $8,300 | $25,800 |
| 2013 | $181 | $32,900 | $8,300 | $24,600 |
Source: Public Records
Map
Nearby Homes