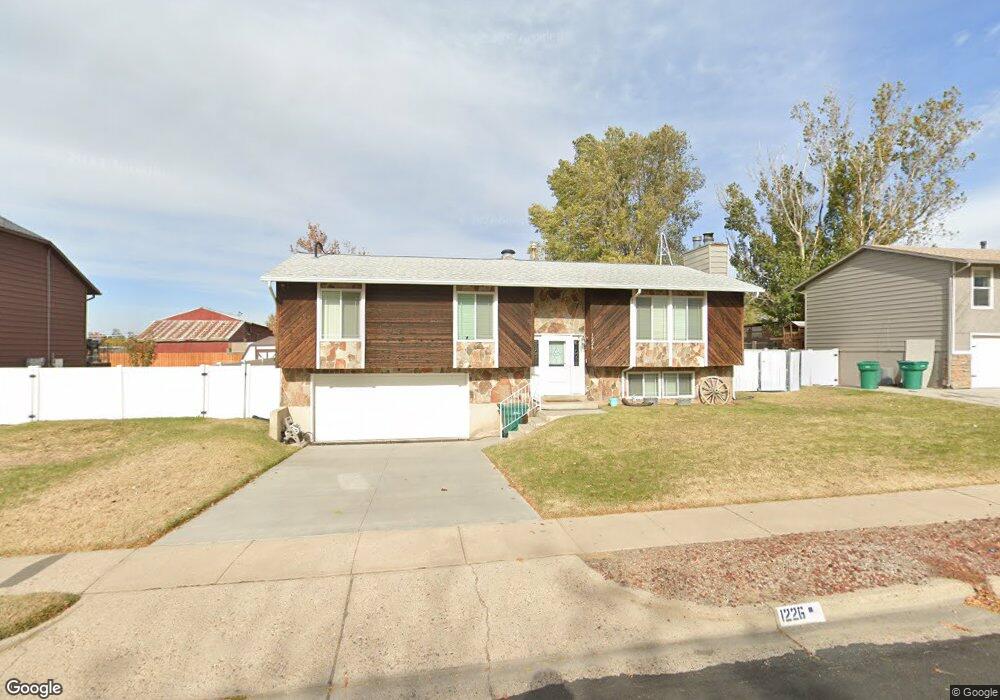
1226 W 725 N Clearfield, UT 84015
Estimated Value: $404,828 - $465,000
3
Beds
1
Bath
1,337
Sq Ft
$329/Sq Ft
Est. Value
About This Home
This home is located at 1226 W 725 N, Clearfield, UT 84015 and is currently estimated at $439,707, approximately $328 per square foot. 1226 W 725 N is a home located in Davis County with nearby schools including Holt Elementary School, North Davis Junior High School, and Syracuse High School.
Ownership History
Date
Name
Owned For
Owner Type
Purchase Details
Closed on
Jan 21, 2005
Sold by
Lucker Bryant J and Lucker Gaye
Bought by
Laker Bryant John and Laker Gaye
Current Estimated Value
Purchase Details
Closed on
Jun 17, 2003
Sold by
Luker Bryant J
Bought by
Luker Bryant J and Luker Gaye
Home Financials for this Owner
Home Financials are based on the most recent Mortgage that was taken out on this home.
Original Mortgage
$83,230
Interest Rate
5.53%
Mortgage Type
FHA
Create a Home Valuation Report for This Property
The Home Valuation Report is an in-depth analysis detailing your home's value as well as a comparison with similar homes in the area
Home Values in the Area
Average Home Value in this Area
Purchase History
| Date | Buyer | Sale Price | Title Company |
|---|---|---|---|
| Laker Bryant John | -- | None Available | |
| Luker Bryant J | -- | Surety Title Agency | |
| Luker Bryant J | -- | Surety Title Agency |
Source: Public Records
Mortgage History
| Date | Status | Borrower | Loan Amount |
|---|---|---|---|
| Previous Owner | Luker Bryant J | $83,230 |
Source: Public Records
Tax History Compared to Growth
Tax History
| Year | Tax Paid | Tax Assessment Tax Assessment Total Assessment is a certain percentage of the fair market value that is determined by local assessors to be the total taxable value of land and additions on the property. | Land | Improvement |
|---|---|---|---|---|
| 2025 | $456 | $212,850 | $73,665 | $139,185 |
| 2024 | $444 | $207,900 | $70,417 | $137,483 |
| 2023 | $404 | $352,000 | $112,552 | $239,448 |
| 2022 | $554 | $200,200 | $64,333 | $135,867 |
| 2021 | $374 | $263,000 | $69,058 | $193,942 |
| 2020 | $1,696 | $228,000 | $58,200 | $169,800 |
| 2019 | $1,650 | $219,000 | $60,541 | $158,459 |
| 2018 | $187 | $189,000 | $53,736 | $135,264 |
| 2016 | $1,252 | $84,645 | $21,509 | $63,136 |
| 2015 | $1,200 | $77,385 | $21,509 | $55,876 |
| 2014 | $1,238 | $80,900 | $21,509 | $59,391 |
| 2013 | -- | $81,429 | $32,175 | $49,254 |
Source: Public Records
Map
Nearby Homes
- 1038 W 800 N
- 844 N 1000 W
- 1337 W 550 N Unit 195
- 563 N 1350 W Unit 139
- 984 N 1100 W
- 1350 W 300 N Unit 49
- 1350 W 300 N Unit 38
- 1350 W 300 N Unit 29
- 423 N 1250 W Unit 118
- 417 N 1200 W Unit 84
- 575 N 1350 W Unit 137
- 690 Barlow St
- 1251 W 400 N Unit 67
- 1239 W 400 N Unit 63
- 1242 W 1075 N
- 303 N Canterbury Way
- 1654 W 600 N
- 1121 N 900 W
- 721 N 800 W
- 626 W 800 N