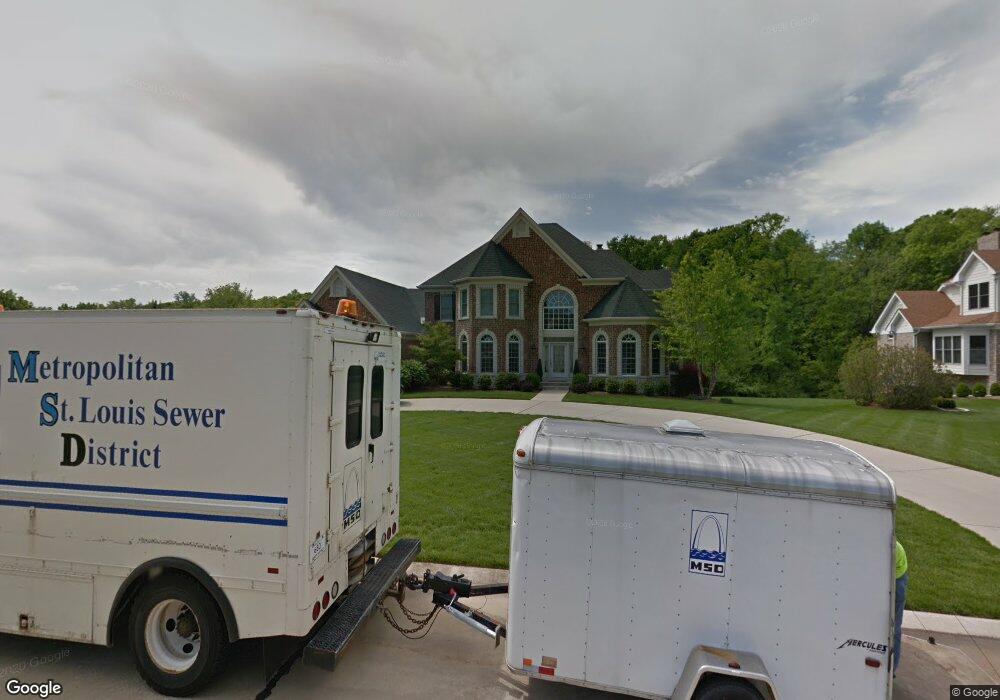
1227 Devonworth Dr Chesterfield, MO 63017
Estimated Value: $1,942,894 - $2,400,000
4
Beds
5
Baths
6,700
Sq Ft
$326/Sq Ft
Est. Value
About This Home
This home is located at 1227 Devonworth Dr, Chesterfield, MO 63017 and is currently estimated at $2,183,631, approximately $325 per square foot. 1227 Devonworth Dr is a home located in St. Louis County with nearby schools including Mason Ridge Elementary School, Parkway West Middle School, and Parkway West High School.
Ownership History
Date
Name
Owned For
Owner Type
Purchase Details
Closed on
Oct 27, 2020
Sold by
Koller Alois J and Koller Sandra S
Bought by
Sandra S Koller Revocable Trust
Current Estimated Value
Purchase Details
Closed on
Mar 6, 2006
Sold by
Miceli Homes Inc
Bought by
Koller Alois J and Koller Sandra S
Home Financials for this Owner
Home Financials are based on the most recent Mortgage that was taken out on this home.
Original Mortgage
$950,000
Interest Rate
6.21%
Mortgage Type
Fannie Mae Freddie Mac
Purchase Details
Closed on
Jun 3, 2005
Sold by
Miceli Development Co
Bought by
Miceli Homes Inc
Home Financials for this Owner
Home Financials are based on the most recent Mortgage that was taken out on this home.
Original Mortgage
$1,105,000
Interest Rate
5.63%
Mortgage Type
Construction
Create a Home Valuation Report for This Property
The Home Valuation Report is an in-depth analysis detailing your home's value as well as a comparison with similar homes in the area
Home Values in the Area
Average Home Value in this Area
Purchase History
| Date | Buyer | Sale Price | Title Company |
|---|---|---|---|
| Sandra S Koller Revocable Trust | -- | None Available | |
| Sandra S Koller Revocable Trust | -- | None Listed On Document | |
| Koller Alois J | $1,472,187 | None Available | |
| Miceli Homes Inc | -- | Cltc |
Source: Public Records
Mortgage History
| Date | Status | Borrower | Loan Amount |
|---|---|---|---|
| Previous Owner | Koller Alois J | $950,000 | |
| Previous Owner | Miceli Homes Inc | $1,105,000 |
Source: Public Records
Tax History
| Year | Tax Paid | Tax Assessment Tax Assessment Total Assessment is a certain percentage of the fair market value that is determined by local assessors to be the total taxable value of land and additions on the property. | Land | Improvement |
|---|---|---|---|---|
| 2025 | $18,862 | $413,520 | $93,670 | $319,850 |
| 2024 | $18,862 | $324,240 | $83,260 | $240,980 |
| 2023 | $18,862 | $324,240 | $83,260 | $240,980 |
| 2022 | $18,763 | $309,700 | $93,670 | $216,030 |
| 2021 | $18,607 | $309,700 | $93,670 | $216,030 |
| 2020 | $18,628 | $296,460 | $89,590 | $206,870 |
| 2019 | $18,366 | $296,460 | $89,590 | $206,870 |
| 2018 | $20,456 | $305,260 | $79,630 | $225,630 |
| 2017 | $20,179 | $305,260 | $79,630 | $225,630 |
| 2016 | $17,160 | $246,770 | $69,670 | $177,100 |
| 2015 | $18,088 | $246,770 | $69,670 | $177,100 |
| 2014 | $14,980 | $222,010 | $112,590 | $109,420 |
Source: Public Records
Map
Nearby Homes
- 1136 Weidman Rd
- 1004 Weidman Rd
- 1388 Wakeshire Terrace
- 900 Weidman Rd
- 14110 Southmill Ct
- 902 Rusticmanor Cir
- 828 Windmill Dr
- 718 Savannah Crossing Way
- 14471 Bantry Ln Unit 11
- 1009 Summer Tree Dr
- 724 Clayton Corners Dr
- 2042 Kentmore Ln Unit F30
- 1061 Summer Tree Dr
- 1359 S Mason Rd
- 14342 Manderleigh Woods Dr
- 14422 Rue de Gascony Ct
- 731 Kraffel Ln
- 14260 Cedar Springs Dr
- 709 Turtle Cove
- 14301 Woods Mill Crossing Unit 202
- 1231 Devonworth Dr
- 1222 Devonworth Dr
- 1235 Devonworth Dr
- 1230 Devonworth Dr
- 1219 Devonworth Dr
- 977 Kimswick Manor Ln
- 969 Wynhaven Ln
- 1214 Devonworth Dr
- 968 Wynhaven Ln
- 971 Kimswick Manor Ln
- 1246 Devonworth Dr
- 1239 Devonworth Dr
- 963 Wynhaven Ln
- 1351 Thornwick Dr
- 962 Wynhaven Ln
- 1254 Devonworth Dr
- 1215 Devonworth Dr
- 1210 Devonworth Dr
- 1357 Thornwick Dr
- 957 Wynhaven Ln
Your Personal Tour Guide
Ask me questions while you tour the home.