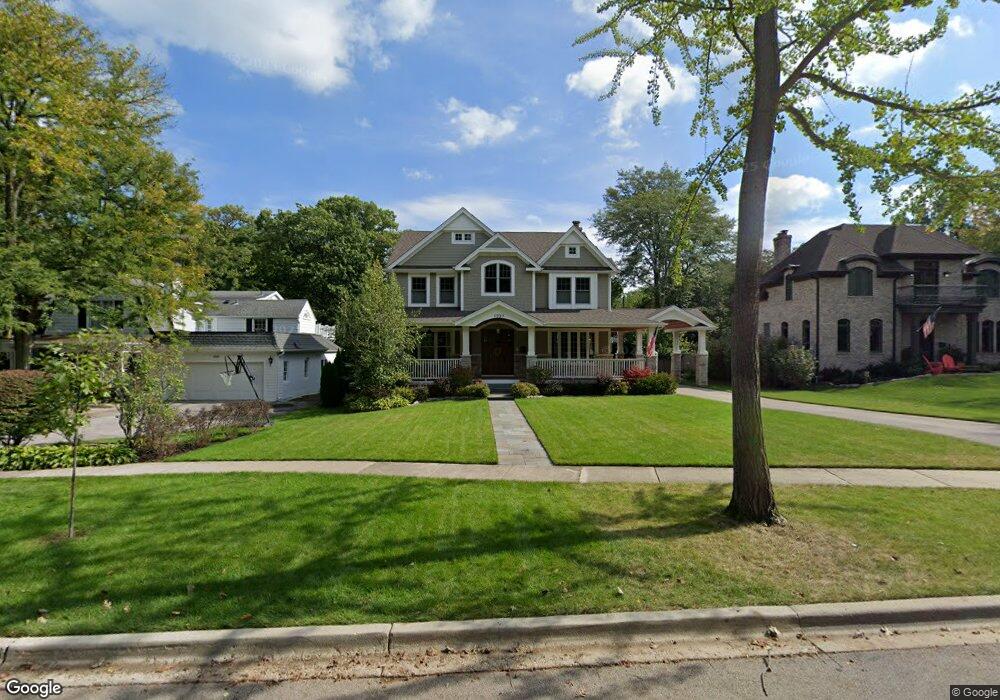
1227 Forest Ave Highland Park, IL 60035
East Highland Park NeighborhoodEstimated Value: $1,013,000 - $1,619,060
4
Beds
4
Baths
3,100
Sq Ft
$439/Sq Ft
Est. Value
About This Home
This home is located at 1227 Forest Ave, Highland Park, IL 60035 and is currently estimated at $1,361,515, approximately $439 per square foot. 1227 Forest Ave is a home located in Lake County with nearby schools including Ravinia Elementary School, Edgewood Middle School, and Highland Park High School.
Ownership History
Date
Name
Owned For
Owner Type
Purchase Details
Closed on
Oct 5, 2012
Sold by
Lofman Marc
Bought by
Stanke John W and Stanke Dara A
Current Estimated Value
Home Financials for this Owner
Home Financials are based on the most recent Mortgage that was taken out on this home.
Original Mortgage
$770,000
Outstanding Balance
$523,306
Interest Rate
3.12%
Mortgage Type
Adjustable Rate Mortgage/ARM
Estimated Equity
$838,209
Purchase Details
Closed on
Jul 19, 2005
Sold by
Fontana Anthony and Fontana Angela
Bought by
Lofman Marc and Greif Gregory C
Home Financials for this Owner
Home Financials are based on the most recent Mortgage that was taken out on this home.
Original Mortgage
$368,000
Interest Rate
2.12%
Mortgage Type
Fannie Mae Freddie Mac
Purchase Details
Closed on
Oct 16, 1996
Sold by
Katz Florence and Florence Katz Declaration Of T
Bought by
Fontana Anthony and Fontana Angela
Purchase Details
Closed on
Feb 3, 1994
Sold by
Katz Harold A and Katz Florence L
Bought by
Katz Florence
Create a Home Valuation Report for This Property
The Home Valuation Report is an in-depth analysis detailing your home's value as well as a comparison with similar homes in the area
Home Values in the Area
Average Home Value in this Area
Purchase History
| Date | Buyer | Sale Price | Title Company |
|---|---|---|---|
| Stanke John W | $368,844 | Chicago Title Insurance Comp | |
| Lofman Marc | $460,000 | Rtc | |
| Fontana Anthony | $241,500 | -- | |
| Katz Florence | -- | -- |
Source: Public Records
Mortgage History
| Date | Status | Borrower | Loan Amount |
|---|---|---|---|
| Open | Stanke John W | $770,000 | |
| Previous Owner | Lofman Marc | $368,000 |
Source: Public Records
Tax History Compared to Growth
Tax History
| Year | Tax Paid | Tax Assessment Tax Assessment Total Assessment is a certain percentage of the fair market value that is determined by local assessors to be the total taxable value of land and additions on the property. | Land | Improvement |
|---|---|---|---|---|
| 2024 | $35,107 | $452,854 | $103,128 | $349,726 |
| 2023 | $32,556 | $408,197 | $92,958 | $315,239 |
| 2022 | $32,556 | $367,516 | $102,120 | $265,396 |
| 2021 | $30,020 | $355,259 | $98,714 | $256,545 |
| 2020 | $29,048 | $355,259 | $98,714 | $256,545 |
| 2019 | $28,067 | $353,597 | $98,252 | $255,345 |
| 2018 | $26,664 | $355,976 | $107,574 | $248,402 |
| 2017 | $26,248 | $353,924 | $106,954 | $246,970 |
| 2016 | $25,315 | $336,942 | $101,822 | $235,120 |
| 2015 | $24,549 | $313,056 | $94,604 | $218,452 |
| 2014 | $6,487 | $304,796 | $84,238 | $220,558 |
| 2012 | $8,562 | $85,694 | $84,729 | $965 |
Source: Public Records
Map
Nearby Homes
- 1330 Sheridan Rd
- 1144 Green Bay Rd
- 906 Pleasant Ave
- 860 Green Bay Rd
- 566 Bellevue Place
- 140 Hazel Ave
- 1601 Oakwood Ave Unit 406
- 650 Walnut St Unit 301
- 1633 2nd St Unit 302
- 55 Prospect Ave
- 600 Broadview Ave
- 1688 Green Bay Rd Unit 404
- 732 Bronson Ln
- 1789 Green Bay Rd Unit B
- 855 Sheridan Rd
- 1572 Mcdaniels Ave
- 1020 Deerfield Rd Unit 1020
- 282 Linden Park Place
- 2021 Saint Johns Ave Unit 4C
- 625 Sheridan Rd
- 1213 Forest Ave
- 1241 Forest Ave
- 1179 Wade St
- 1187 Wade St
- 1257 Forest Ave
- 1220 Forest Ave
- 1210 Forest Ave
- 1230 Forest Ave
- 1181 Wade St
- 1240 Forest Ave
- 1250 Forest Ave
- 1267 Forest Ave
- 1177 Wade St
- 1175 Wade St
- 1256 Forest Ave
- 1212 St Johns Ave
- 1245 Saint Johns Ave
- 1173 Wade St
- 1277 Forest Ave
- 1200 Saint Johns Ave