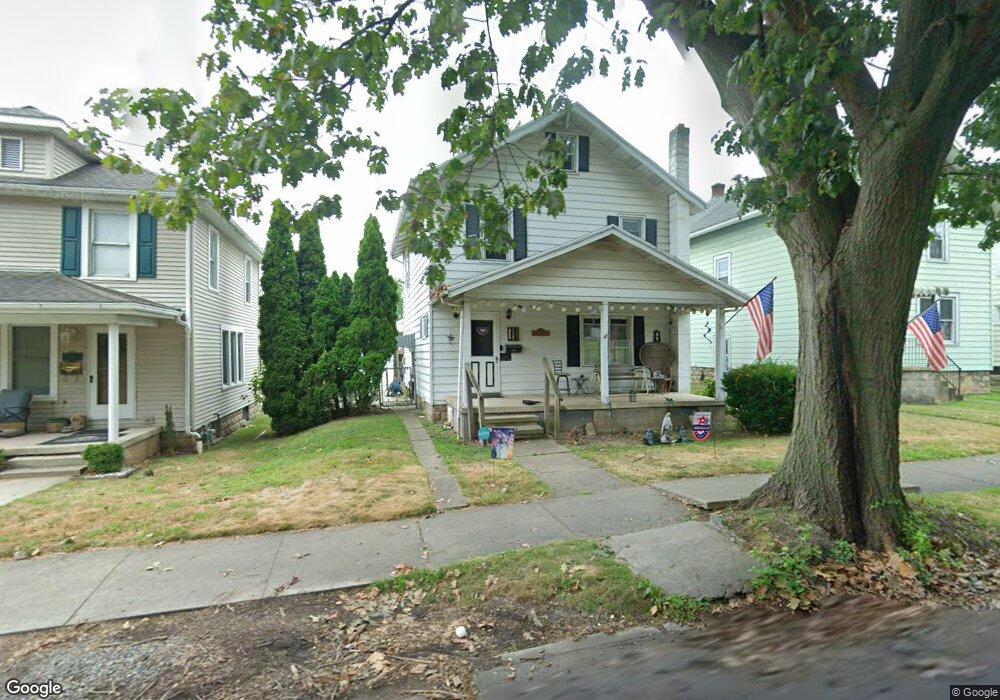
1227 High St Williamsport, PA 17701
Estimated Value: $98,000 - $142,000
3
Beds
1
Bath
1,344
Sq Ft
$89/Sq Ft
Est. Value
About This Home
This home is located at 1227 High St, Williamsport, PA 17701 and is currently estimated at $119,323, approximately $88 per square foot. 1227 High St is a home located in Lycoming County with nearby schools including Stevens Elementary School, Curtin Intermediate School, and Williamsport Area Senior High School.
Ownership History
Date
Name
Owned For
Owner Type
Purchase Details
Closed on
May 5, 2021
Sold by
Wilson A Paul A and Wilson Beth B
Bought by
Parks Charles W
Current Estimated Value
Home Financials for this Owner
Home Financials are based on the most recent Mortgage that was taken out on this home.
Original Mortgage
$62,840
Interest Rate
2.9%
Mortgage Type
FHA
Purchase Details
Closed on
Dec 18, 1992
Sold by
Hartzel Jr Hartzel P and Hartzel Sandra
Bought by
Wilson Wilson A and Wilson Beth B
Create a Home Valuation Report for This Property
The Home Valuation Report is an in-depth analysis detailing your home's value as well as a comparison with similar homes in the area
Home Values in the Area
Average Home Value in this Area
Purchase History
| Date | Buyer | Sale Price | Title Company |
|---|---|---|---|
| Parks Charles W | $64,000 | None Available | |
| Wilson Wilson A | $64,000 | -- |
Source: Public Records
Mortgage History
| Date | Status | Borrower | Loan Amount |
|---|---|---|---|
| Previous Owner | Parks Charles W | $62,840 |
Source: Public Records
Tax History Compared to Growth
Tax History
| Year | Tax Paid | Tax Assessment Tax Assessment Total Assessment is a certain percentage of the fair market value that is determined by local assessors to be the total taxable value of land and additions on the property. | Land | Improvement |
|---|---|---|---|---|
| 2025 | $2,785 | $68,270 | $18,000 | $50,270 |
| 2024 | $2,762 | $68,270 | $18,000 | $50,270 |
| 2023 | $2,728 | $68,270 | $18,000 | $50,270 |
| 2022 | $2,728 | $68,270 | $18,000 | $50,270 |
| 2021 | $2,704 | $68,270 | $18,000 | $50,270 |
| 2020 | $2,670 | $68,270 | $18,000 | $50,270 |
| 2019 | $2,626 | $68,270 | $18,000 | $50,270 |
| 2018 | $2,552 | $68,270 | $18,000 | $50,270 |
| 2017 | $2,478 | $68,270 | $18,000 | $50,270 |
| 2016 | $2,293 | $68,270 | $18,000 | $50,270 |
| 2015 | $1,598 | $68,270 | $18,000 | $50,270 |
Source: Public Records
Map
Nearby Homes