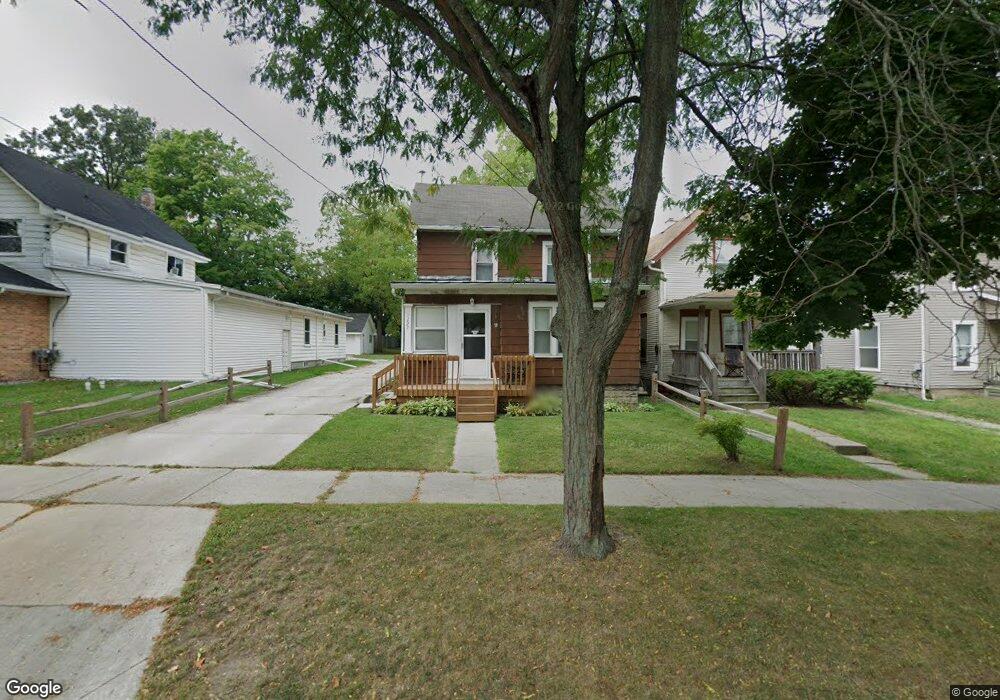
1227 N Walnut St Lansing, MI 48906
Old Forest NeighborhoodEstimated Value: $82,000 - $113,000
Studio
--
Bath
1,432
Sq Ft
$67/Sq Ft
Est. Value
About This Home
This home is located at 1227 N Walnut St, Lansing, MI 48906 and is currently estimated at $95,717, approximately $66 per square foot. 1227 N Walnut St is a home located in Ingham County with nearby schools including Willow School, Pattengill Academy, and J.W. Sexton High School.
Ownership History
Date
Name
Owned For
Owner Type
Purchase Details
Closed on
Jul 25, 2020
Sold by
Shaker Mouhamnmed M
Bought by
Adkikan Pampha
Current Estimated Value
Home Financials for this Owner
Home Financials are based on the most recent Mortgage that was taken out on this home.
Original Mortgage
$55,000
Outstanding Balance
$38,771
Interest Rate
3%
Mortgage Type
New Conventional
Estimated Equity
$56,946
Purchase Details
Closed on
Jun 18, 2002
Sold by
Brown William
Bought by
Vandamme Todd Andrew and Vandamme Melissa Mary
Home Financials for this Owner
Home Financials are based on the most recent Mortgage that was taken out on this home.
Original Mortgage
$32,000
Interest Rate
6.8%
Purchase Details
Closed on
Dec 15, 1997
Sold by
Johnson Dennis G and Johnson Melissa M
Bought by
Johnson Melissa M
Purchase Details
Closed on
Aug 1, 1996
Bought by
Johnson Dennis G and Johnson Melissa M
Create a Home Valuation Report for This Property
The Home Valuation Report is an in-depth analysis detailing your home's value as well as a comparison with similar homes in the area
Home Values in the Area
Average Home Value in this Area
Purchase History
| Date | Buyer | Sale Price | Title Company |
|---|---|---|---|
| Adkikan Pampha | -- | None Available | |
| Vandamme Todd Andrew | $40,000 | -- | |
| Johnson Melissa M | -- | -- | |
| Johnson Dennis G | $25,000 | -- |
Source: Public Records
Mortgage History
| Date | Status | Borrower | Loan Amount |
|---|---|---|---|
| Open | Adkikan Pampha | $55,000 | |
| Previous Owner | Vandamme Todd Andrew | $32,000 |
Source: Public Records
Tax History
| Year | Tax Paid | Tax Assessment Tax Assessment Total Assessment is a certain percentage of the fair market value that is determined by local assessors to be the total taxable value of land and additions on the property. | Land | Improvement |
|---|---|---|---|---|
| 2025 | $1,472 | $52,000 | $3,000 | $49,000 |
| 2024 | $11 | $47,300 | $3,000 | $44,300 |
| 2023 | $1,383 | $38,300 | $3,000 | $35,300 |
| 2022 | $1,252 | $34,500 | $3,300 | $31,200 |
| 2021 | $1,226 | $31,800 | $5,200 | $26,600 |
| 2020 | $1,218 | $29,000 | $5,200 | $23,800 |
| 2019 | $1,165 | $27,900 | $5,200 | $22,700 |
| 2018 | $1,095 | $25,200 | $5,200 | $20,000 |
| 2017 | $1,047 | $25,200 | $5,200 | $20,000 |
| 2016 | $1,002 | $24,800 | $5,200 | $19,600 |
| 2015 | $1,002 | $24,100 | $10,331 | $13,769 |
| 2014 | $1,002 | $24,800 | $15,750 | $9,050 |
Source: Public Records
Map
Nearby Homes
- 409 W César E Chávez Ave
- 406 Pleasant St
- 1226 N Grand River Ave
- 1023 Seymour Ave
- 110 E Willow St
- 1031 N Washington Ave
- 925 N Pine St
- 920 N Capitol Ave Unit 1
- 908 N Capitol Ave
- 921 N Sycamore St
- 1315 Roosevelt Ave
- 1441 Knollwood Ave
- 809 Seymour Ave
- 733 N Walnut St
- 733 N Pine St
- 312 W Saginaw St Unit 1
- 417 Liberty St
- 1544 Lansing Ave
- 427 Liberty St
- 820 Princeton Ave
- 1219 N Walnut St
- 409 W Willow St
- 1233 N Walnut St
- 413 W Willow St
- 1235 N Walnut St
- 1213 N Walnut St
- 419 W Willow St
- 423 W Willow St
- 1220 N Chestnut St
- 1203 N Walut
- 410 W Grand River Ave
- 404 W Grand River Ave
- 1216 N Walnut St
- 1216 N Walnut St Unit 2
- 404 W César E Chávez Ave
- 1224 N Chestnut St
- 406 W Willow St
- 1226 N Chestnut St
- 1224 N Walnut St
Your Personal Tour Guide
Ask me questions while you tour the home.