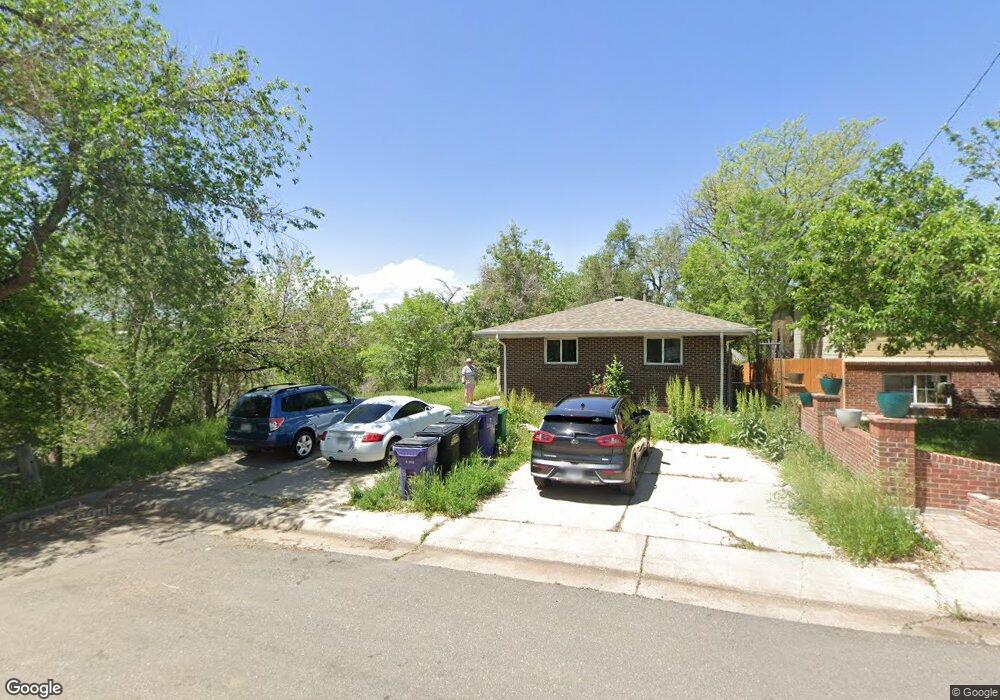
1227 Raleigh St Denver, CO 80204
West Colfax NeighborhoodEstimated Value: $455,615 - $587,000
2
Beds
1
Bath
1,536
Sq Ft
$328/Sq Ft
Est. Value
About This Home
This home is located at 1227 Raleigh St, Denver, CO 80204 and is currently estimated at $503,904, approximately $328 per square foot. 1227 Raleigh St is a home located in Denver County with nearby schools including Colfax Elementary School, Lake Middle School, and North High School.
Ownership History
Date
Name
Owned For
Owner Type
Purchase Details
Closed on
Jun 25, 2010
Sold by
Secretary Of Housing & Urban Development
Bought by
Coyle Amelia
Current Estimated Value
Home Financials for this Owner
Home Financials are based on the most recent Mortgage that was taken out on this home.
Original Mortgage
$66,400
Outstanding Balance
$44,453
Interest Rate
4.87%
Mortgage Type
New Conventional
Estimated Equity
$459,451
Purchase Details
Closed on
Feb 25, 2010
Sold by
Valdez Peter Paul
Bought by
Secretary Of Housing & Urban Development
Purchase Details
Closed on
Sep 15, 2009
Sold by
Valdez Peter Paul
Bought by
Barton David
Purchase Details
Closed on
Oct 26, 2001
Sold by
Montano Investments Inc
Bought by
Valdez Peter Paul
Home Financials for this Owner
Home Financials are based on the most recent Mortgage that was taken out on this home.
Original Mortgage
$134,056
Interest Rate
6.77%
Mortgage Type
FHA
Create a Home Valuation Report for This Property
The Home Valuation Report is an in-depth analysis detailing your home's value as well as a comparison with similar homes in the area
Home Values in the Area
Average Home Value in this Area
Purchase History
| Date | Buyer | Sale Price | Title Company |
|---|---|---|---|
| Coyle Amelia | $83,000 | None Available | |
| Secretary Of Housing & Urban Development | -- | None Available | |
| Barton David | -- | None Available | |
| Valdez Peter Paul | $135,950 | Land Title |
Source: Public Records
Mortgage History
| Date | Status | Borrower | Loan Amount |
|---|---|---|---|
| Open | Coyle Amelia | $66,400 | |
| Previous Owner | Valdez Peter Paul | $134,056 | |
| Closed | Valdez Peter Paul | $5,000 |
Source: Public Records
Tax History Compared to Growth
Tax History
| Year | Tax Paid | Tax Assessment Tax Assessment Total Assessment is a certain percentage of the fair market value that is determined by local assessors to be the total taxable value of land and additions on the property. | Land | Improvement |
|---|---|---|---|---|
| 2024 | $2,667 | $33,670 | $8,710 | $24,960 |
| 2023 | $2,609 | $33,670 | $8,710 | $24,960 |
| 2022 | $2,150 | $27,030 | $11,340 | $15,690 |
| 2021 | $2,075 | $27,810 | $11,670 | $16,140 |
| 2020 | $2,188 | $29,490 | $11,670 | $17,820 |
| 2019 | $2,127 | $29,490 | $11,670 | $17,820 |
| 2018 | $1,695 | $21,910 | $7,050 | $14,860 |
| 2017 | $1,690 | $21,910 | $7,050 | $14,860 |
| 2016 | $1,030 | $12,630 | $3,900 | $8,730 |
| 2015 | $987 | $12,630 | $3,900 | $8,730 |
| 2014 | $725 | $8,730 | $868 | $7,862 |
Source: Public Records
Map
Nearby Homes
- 1287 Quitman St
- 1208 Quitman St Unit 305
- 1284 Quitman St
- 1216 Perry St
- 1030 Tennyson St Unit 1032
- 1245 Utica St Unit 104
- 1250 Osceola St Unit 2
- 949 Raleigh St Unit 2
- 1333 Utica St
- 1231 Newton St
- 1229 Newton St
- 1352 Newton St
- 925 Quitman St
- 1339 Newton St
- 1258 Newton St Unit 2
- 1258 Newton St Unit 1
- 3955 W 14th Ave
- 1256 Newton St
- 1418 Perry St
- 1433 Perry St
- 1235 Raleigh St
- 1225 Raleigh St
- 1243 Raleigh St
- 1245 Raleigh St
- 1240 Raleigh St
- 1247 Raleigh St
- 1242 Raleigh St
- 1252 Raleigh St
- 1248 Raleigh St
- 1244 Stuart St
- 1257 Raleigh St Unit 1259
- 1244 Raleigh St
- 1256 Raleigh St
- 1257 N Raleigh St
- 1254 Stuart St
- 1259 Raleigh St
- 1232 Stuart St
- 1254 Raleigh St
- 1260 Stuart St
- 1260 Stuart St Unit 1