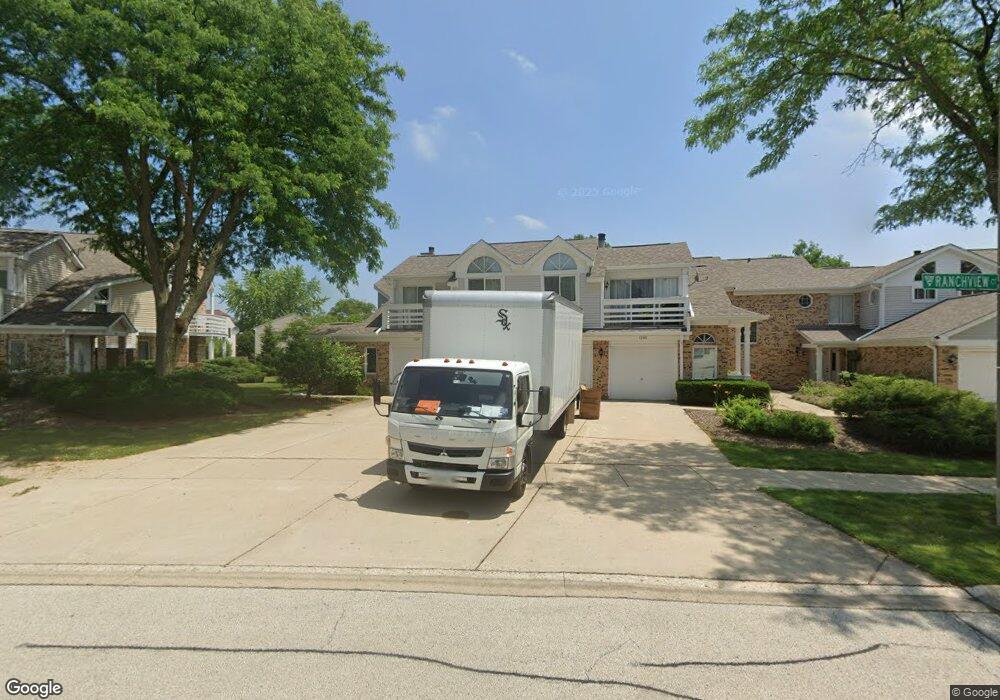
1227 Ranch View Ct Unit 2 Buffalo Grove, IL 60089
Prairie Park-Lake County NeighborhoodEstimated Value: $286,714 - $315,000
2
Beds
2
Baths
1,154
Sq Ft
$260/Sq Ft
Est. Value
About This Home
This home is located at 1227 Ranch View Ct Unit 2, Buffalo Grove, IL 60089 and is currently estimated at $299,929, approximately $259 per square foot. 1227 Ranch View Ct Unit 2 is a home located in Lake County with nearby schools including Prairie Elementary School, Twin Groves Middle School, and Adlai E Stevenson High School.
Ownership History
Date
Name
Owned For
Owner Type
Purchase Details
Closed on
Nov 5, 2025
Sold by
Sumberdariya Enke-Orgil
Bought by
Enkh-Orgilsumberdariya Living Trust and Sumberdariya
Current Estimated Value
Purchase Details
Closed on
Sep 5, 2024
Sold by
Derecho Therese C
Bought by
Enkh-Orgil Sumberdariya
Home Financials for this Owner
Home Financials are based on the most recent Mortgage that was taken out on this home.
Original Mortgage
$255,000
Interest Rate
6.13%
Mortgage Type
VA
Purchase Details
Closed on
May 19, 2006
Sold by
Bleser Camille S
Bought by
Derecho Therese C
Home Financials for this Owner
Home Financials are based on the most recent Mortgage that was taken out on this home.
Original Mortgage
$211,500
Interest Rate
6.68%
Mortgage Type
Unknown
Purchase Details
Closed on
Feb 19, 1996
Sold by
Bleser Camille S
Bought by
Bleser Camille S
Purchase Details
Closed on
Sep 15, 1995
Sold by
Wargo Carol V and Thiessen Keri E
Bought by
Bleser Camille S
Create a Home Valuation Report for This Property
The Home Valuation Report is an in-depth analysis detailing your home's value as well as a comparison with similar homes in the area
Home Values in the Area
Average Home Value in this Area
Purchase History
| Date | Buyer | Sale Price | Title Company |
|---|---|---|---|
| Enkh-Orgilsumberdariya Living Trust | -- | None Listed On Document | |
| Enkh-Orgil Sumberdariya | $255,000 | None Listed On Document | |
| Derecho Therese C | $212,000 | Cti | |
| Bleser Camille S | -- | -- | |
| Bleser Camille S | $120,000 | Republic Title Company |
Source: Public Records
Mortgage History
| Date | Status | Borrower | Loan Amount |
|---|---|---|---|
| Previous Owner | Enkh-Orgil Sumberdariya | $255,000 | |
| Previous Owner | Derecho Therese C | $211,500 |
Source: Public Records
Tax History Compared to Growth
Tax History
| Year | Tax Paid | Tax Assessment Tax Assessment Total Assessment is a certain percentage of the fair market value that is determined by local assessors to be the total taxable value of land and additions on the property. | Land | Improvement |
|---|---|---|---|---|
| 2024 | $7,265 | $75,058 | $30,642 | $44,416 |
| 2023 | $6,130 | $70,823 | $28,913 | $41,910 |
| 2022 | $6,130 | $58,790 | $24,001 | $34,789 |
| 2021 | $5,901 | $58,156 | $23,742 | $34,414 |
| 2020 | $5,761 | $58,354 | $23,823 | $34,531 |
| 2019 | $5,101 | $58,139 | $23,735 | $34,404 |
| 2018 | $4,401 | $52,511 | $25,799 | $26,712 |
| 2017 | $4,314 | $51,285 | $25,197 | $26,088 |
| 2016 | $4,186 | $49,109 | $24,128 | $24,981 |
| 2015 | $4,050 | $45,926 | $22,564 | $23,362 |
| 2014 | $4,432 | $49,055 | $24,235 | $24,820 |
| 2012 | $4,382 | $49,154 | $24,284 | $24,870 |
Source: Public Records
Map
Nearby Homes
- 1027 Courtland Dr Unit 20
- 1327 Larchmont Dr
- 12 Cloverdale Ct
- 5107 N Arlington Heights Rd
- 1325 Fairfax Ln
- 1315 Gail Dr
- 1117 Franklin Ln Unit C52
- 760 Checker Dr
- 810 Silver Rock Ln
- 620 Twisted Oak Ln
- 5135 Bridlewood Ct
- 531 Lasalle Ln
- 4106 Bob o Link Ln
- 1514 Sumter Dr
- 630 Woodhollow Ln
- 938 Hidden Lake Dr
- 5255 Danbury Ct
- 1545 Chickamauga Ln
- 1272 Sandhurst Dr
- 131 Autumn Ct Unit CT10602
- 1225 Ranch View Ct Unit 2
- 1225 Ranchview Ct
- 1229 Ranch View Ct Unit 2
- 1223 Ranch View Ct Unit 2
- 1227 Ranchview Ct
- 1221 Ranch View Ct
- 1221 Ranchview Ct
- 1219 Ranch View Ct Unit 2
- 1217 Ranch View Ct Unit 2
- 1217 Ranchview Ct
- 1217 Ranch View Ct Unit 1217
- 1217 Ranchview Ct Unit 1217
- 1231 Ranch View Ct
- 1215 Ranch View Ct Unit 2
- 1233 Ranch View Ct Unit 3
- 1213 Ranch View Ct Unit 2
- 1235 Ranch View Ct Unit 3
- 1237 Ranch View Ct Unit 3
- 1211 Ranch View Ct Unit 2
- 1339 Devonshire Rd