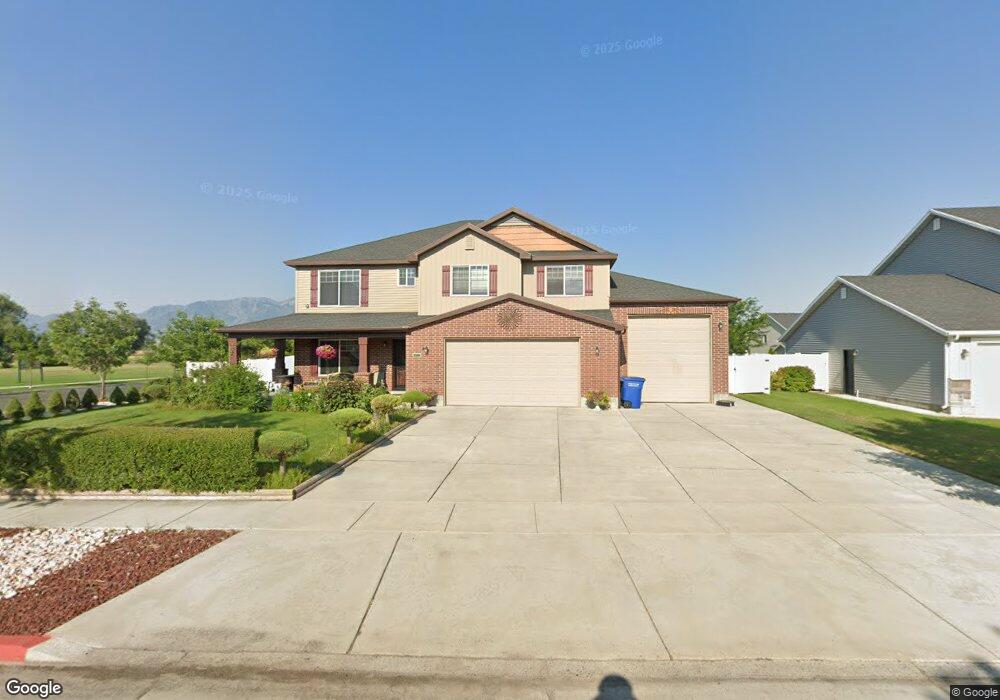
1227 S 830 W Logan, UT 84321
Woodruff NeighborhoodEstimated Value: $540,649 - $584,000
4
Beds
3
Baths
2,708
Sq Ft
$208/Sq Ft
Est. Value
About This Home
This home is located at 1227 S 830 W, Logan, UT 84321 and is currently estimated at $564,412, approximately $208 per square foot. 1227 S 830 W is a home located in Cache County with nearby schools including Woodruff School, Mount Logan Middle School, and Logan High School.
Ownership History
Date
Name
Owned For
Owner Type
Purchase Details
Closed on
Sep 16, 2020
Sold by
Seng Setha and Seng Sokheoung
Bought by
Seng Setha and Seng Sokheoung
Current Estimated Value
Purchase Details
Closed on
Mar 24, 2011
Sold by
Kartchner Homes Cv Division Inc
Bought by
Seng Setha and Seng Sokhoeung
Purchase Details
Closed on
Feb 11, 2011
Sold by
Continental Development Inc
Bought by
Kartchner Homes Cv Division Inc
Create a Home Valuation Report for This Property
The Home Valuation Report is an in-depth analysis detailing your home's value as well as a comparison with similar homes in the area
Home Values in the Area
Average Home Value in this Area
Purchase History
| Date | Buyer | Sale Price | Title Company |
|---|---|---|---|
| Seng Setha | -- | None Available | |
| Seng Setha | -- | Cache Title Company | |
| Kartchner Homes Cv Division Inc | -- | Cache Title Company |
Source: Public Records
Tax History Compared to Growth
Tax History
| Year | Tax Paid | Tax Assessment Tax Assessment Total Assessment is a certain percentage of the fair market value that is determined by local assessors to be the total taxable value of land and additions on the property. | Land | Improvement |
|---|---|---|---|---|
| 2025 | $2,407 | $311,325 | $0 | $0 |
| 2024 | $2,473 | $309,725 | $0 | $0 |
| 2023 | $2,573 | $307,175 | $0 | $0 |
| 2022 | $2,410 | $268,675 | $0 | $0 |
| 2021 | $2,144 | $369,302 | $50,000 | $319,302 |
| 2020 | $2,114 | $327,654 | $50,000 | $277,654 |
| 2019 | $2,209 | $327,653 | $50,000 | $277,653 |
| 2018 | $2,200 | $297,905 | $50,000 | $247,905 |
| 2017 | $2,121 | $151,855 | $0 | $0 |
| 2016 | $2,199 | $135,540 | $0 | $0 |
| 2015 | $1,965 | $135,540 | $0 | $0 |
| 2014 | $1,776 | $135,540 | $0 | $0 |
| 2013 | -- | $135,540 | $0 | $0 |
Source: Public Records
Map
Nearby Homes
- 1206 S 900 W
- 736 Majestic Dr
- 985 W 720 S
- 866 Riverwood Dr
- 420 S 1400 W
- 553 Center Ave
- 740 S 350 W
- 1183 W 1820 S
- 1645 S 1380 W
- 501 Southwest St
- 658 W 500 S
- 268 W 1030 S
- 1220 W 575 S
- 2242 S 1120 W Unit 69
- 2254 S 1120 W Unit 72
- 2250 S 1120 W Unit 71
- 2258 S 1120 W Unit 73
- 2246 S 1120 W Unit 70
- 2238 S 1120 W Unit 68
- 265 W 1010 S