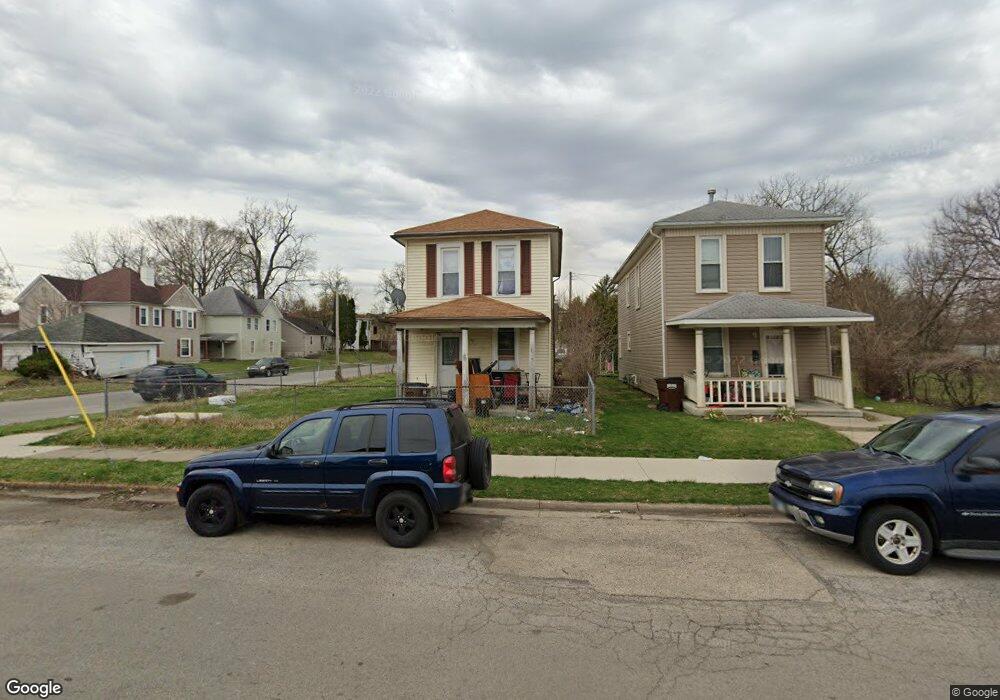
1227 Tibbetts Ave Springfield, OH 45505
Estimated Value: $66,275 - $99,000
2
Beds
1
Bath
1,152
Sq Ft
$68/Sq Ft
Est. Value
About This Home
This home is located at 1227 Tibbetts Ave, Springfield, OH 45505 and is currently estimated at $78,319, approximately $67 per square foot. 1227 Tibbetts Ave is a home located in Clark County with nearby schools including Lincoln Elementary School, Hayward Middle School, and Springfield High School.
Ownership History
Date
Name
Owned For
Owner Type
Purchase Details
Closed on
Aug 26, 2016
Sold by
Hardy Beverley A and Hardy George
Bought by
Sacche Martin Chay
Current Estimated Value
Purchase Details
Closed on
Jun 1, 2009
Sold by
Holbrook Kimberly
Bought by
Hardy Beverly A and Hardy Beverly
Purchase Details
Closed on
Jun 13, 2006
Sold by
Washington Mutual Bank
Bought by
Hardy Beverly and Holbrook Kimberly
Purchase Details
Closed on
Jun 5, 2006
Sold by
Hud
Bought by
Washington Mutual Bank
Purchase Details
Closed on
May 3, 2005
Sold by
Derosa Gerald C
Bought by
Hud
Purchase Details
Closed on
Sep 2, 1997
Sold by
Foster Michael A
Bought by
Derosa Gerald C and Derosa Sharon
Home Financials for this Owner
Home Financials are based on the most recent Mortgage that was taken out on this home.
Original Mortgage
$40,388
Interest Rate
7.57%
Mortgage Type
FHA
Purchase Details
Closed on
Feb 1, 1997
Sold by
Barbarino Anthony J
Bought by
Michael A Foster Trustee
Create a Home Valuation Report for This Property
The Home Valuation Report is an in-depth analysis detailing your home's value as well as a comparison with similar homes in the area
Home Values in the Area
Average Home Value in this Area
Purchase History
| Date | Buyer | Sale Price | Title Company |
|---|---|---|---|
| Sacche Martin Chay | $18,000 | None Available | |
| Hardy Beverly A | -- | None Available | |
| Hardy Beverly | $4,000 | Resource Title Agency Inc | |
| Washington Mutual Bank | -- | None Available | |
| Hud | $10,000 | None Available | |
| Derosa Gerald C | $40,000 | -- | |
| Michael A Foster Trustee | $21,000 | -- |
Source: Public Records
Mortgage History
| Date | Status | Borrower | Loan Amount |
|---|---|---|---|
| Previous Owner | Derosa Gerald C | $40,388 | |
| Closed | Michael A Foster Trustee | $0 |
Source: Public Records
Tax History Compared to Growth
Tax History
| Year | Tax Paid | Tax Assessment Tax Assessment Total Assessment is a certain percentage of the fair market value that is determined by local assessors to be the total taxable value of land and additions on the property. | Land | Improvement |
|---|---|---|---|---|
| 2024 | $345 | $6,990 | $1,230 | $5,760 |
| 2023 | $531 | $6,990 | $1,230 | $5,760 |
| 2022 | $354 | $6,990 | $1,230 | $5,760 |
| 2021 | $318 | $5,780 | $1,020 | $4,760 |
| 2020 | $318 | $5,780 | $1,020 | $4,760 |
| 2019 | $319 | $5,780 | $1,020 | $4,760 |
| 2018 | $219 | $3,800 | $850 | $2,950 |
| 2017 | $218 | $3,798 | $851 | $2,947 |
| 2016 | $219 | $3,798 | $851 | $2,947 |
| 2015 | $337 | $3,700 | $851 | $2,849 |
| 2014 | $216 | $3,700 | $851 | $2,849 |
| 2013 | $332 | $3,700 | $851 | $2,849 |
Source: Public Records
Map
Nearby Homes
- 550 E Rose St
- 1519 Tibbetts Ave
- 1435 Logan Ave
- 1047 Cypress St
- 551 Georgia Ave
- 127 Rice St
- 1159 Selma Rd
- 1024 Elder St
- 902 Cypress St
- 1111 Lafayette Ave
- 705 York St
- 1102 Pine St
- 1820 Clay St
- 35 E Grand Ave
- 1018 Pine St
- 0 W Perrin Ave Unit 945728
- 0 W Perrin Ave Unit 1041970
- 710-712 Cypress St
- 1355 S Fountain Ave
- 833 S Limestone St
- 1225 Tibbetts Ave
- 1221 Tibbetts Ave
- 532 Rice St
- 1303 Tibbetts Ave
- 530 Rice St
- 1307 Tibbetts Ave
- 516 Rice St
- 1211 Tibbetts Ave
- 535 Rice St Unit 537
- 1230 Tibbetts Ave
- 1224 Tibbetts Ave
- 1311 Tibbetts Ave
- 531 Rice St
- 1222 Tibbetts Ave
- 514 Rice St
- 1209 Tibbetts Ave
- 603 Rice St
- 1214 Tibbetts Ave
- 525 Rice St
- 512 Rice St