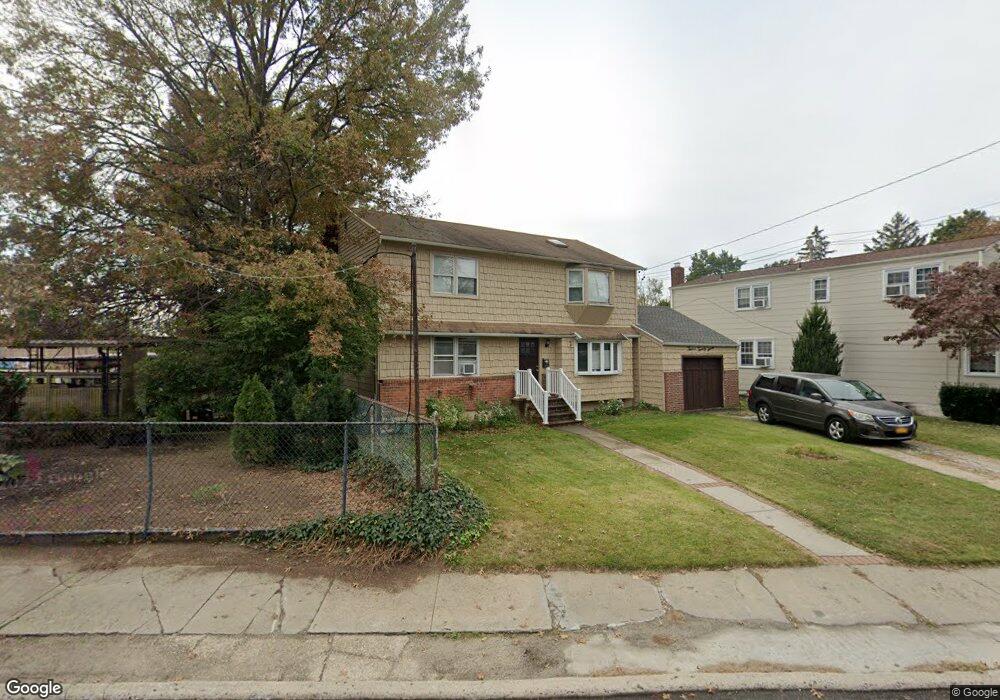
1227 Tulip Ave Franklin Square, NY 11010
Estimated Value: $889,983 - $979,000
4
Beds
2
Baths
1,715
Sq Ft
$545/Sq Ft
Est. Value
About This Home
This home is located at 1227 Tulip Ave, Franklin Square, NY 11010 and is currently estimated at $934,492, approximately $544 per square foot. 1227 Tulip Ave is a home located in Nassau County with nearby schools including St Anne's School and Our Lady Of Victory School.
Ownership History
Date
Name
Owned For
Owner Type
Purchase Details
Closed on
Nov 17, 2016
Sold by
Siddiqui Afshan and Siddiqui Arif
Bought by
Imran Muhammad
Current Estimated Value
Home Financials for this Owner
Home Financials are based on the most recent Mortgage that was taken out on this home.
Original Mortgage
$417,000
Outstanding Balance
$335,830
Interest Rate
3.52%
Mortgage Type
New Conventional
Estimated Equity
$598,662
Purchase Details
Closed on
May 22, 2000
Sold by
Farooqui Nasir and Farooqui Nadira
Bought by
Siddiqui Arif
Create a Home Valuation Report for This Property
The Home Valuation Report is an in-depth analysis detailing your home's value as well as a comparison with similar homes in the area
Home Values in the Area
Average Home Value in this Area
Purchase History
| Date | Buyer | Sale Price | Title Company |
|---|---|---|---|
| Imran Muhammad | $470,000 | The Judicial Title Insurance | |
| Siddiqui Arif | $200,000 | Thomas Czik |
Source: Public Records
Mortgage History
| Date | Status | Borrower | Loan Amount |
|---|---|---|---|
| Open | Imran Muhammad | $417,000 |
Source: Public Records
Tax History
| Year | Tax Paid | Tax Assessment Tax Assessment Total Assessment is a certain percentage of the fair market value that is determined by local assessors to be the total taxable value of land and additions on the property. | Land | Improvement |
|---|---|---|---|---|
| 2025 | $11,335 | $536 | $271 | $265 |
| 2024 | $2,203 | $574 | $290 | $284 |
Source: Public Records
Map
Nearby Homes
- 272 Jefferson Ave
- 700 Tulip Ave
- 217 Elton Rd
- 90 Amherst St
- 92 Amherst St
- 120 Barrymore Blvd
- 178 Carlton Terrace
- 182 Lexington Ave
- 143 Bromleigh Rd
- 112 Bromleigh Rd
- 114 Lexington Ave
- 69 Jefferson St
- 44 Remsen St
- 67 Elton Rd
- 501 Tulip Ave Unit A
- 9 Clinton St
- 20 Salisbury Ave
- 51 Pacific St
- 17 Litchfield Av #1 Ave
- 7 Yale St
Your Personal Tour Guide
Ask me questions while you tour the home.