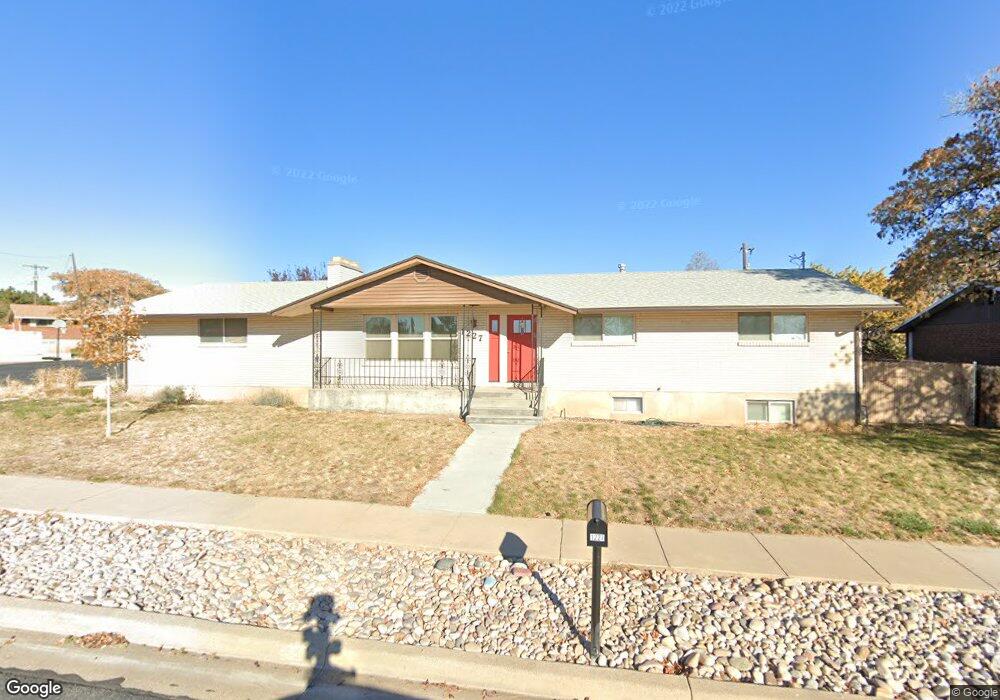
1227 Valhalla Dr Clearfield, UT 84015
Estimated Value: $442,000 - $464,000
6
Beds
3
Baths
2,754
Sq Ft
$165/Sq Ft
Est. Value
About This Home
This home is located at 1227 Valhalla Dr, Clearfield, UT 84015 and is currently estimated at $453,505, approximately $164 per square foot. 1227 Valhalla Dr is a home located in Davis County with nearby schools including South Clearfield Elementary School, North Davis Junior High School, and Clearfield High School.
Ownership History
Date
Name
Owned For
Owner Type
Purchase Details
Closed on
Feb 19, 2019
Sold by
Smith Elizabeth F
Bought by
Smith Elizabeth F and The Elizabeth F Smith Trust
Current Estimated Value
Purchase Details
Closed on
Aug 24, 2005
Sold by
Smith S Aaron and Smith Elizabeth F
Bought by
Smith Stanley Aron and Smith Elizabeth F
Home Financials for this Owner
Home Financials are based on the most recent Mortgage that was taken out on this home.
Original Mortgage
$14,750
Interest Rate
5.18%
Mortgage Type
Stand Alone Second
Purchase Details
Closed on
Oct 28, 2004
Sold by
Hess Audrey P
Bought by
Smith S Aaron and Smith Elizabeth F
Home Financials for this Owner
Home Financials are based on the most recent Mortgage that was taken out on this home.
Original Mortgage
$129,960
Interest Rate
5.69%
Mortgage Type
FHA
Create a Home Valuation Report for This Property
The Home Valuation Report is an in-depth analysis detailing your home's value as well as a comparison with similar homes in the area
Home Values in the Area
Average Home Value in this Area
Purchase History
| Date | Buyer | Sale Price | Title Company |
|---|---|---|---|
| Smith Elizabeth F | -- | None Available | |
| Smith Stanley Aron | -- | Bonneville Title Company | |
| Smith S Aaron | -- | Equity Title Agency |
Source: Public Records
Mortgage History
| Date | Status | Borrower | Loan Amount |
|---|---|---|---|
| Closed | Smith Stanley Aron | $14,750 | |
| Open | Smith Stanley Aron | $118,000 | |
| Closed | Smith S Aaron | $129,960 |
Source: Public Records
Tax History
| Year | Tax Paid | Tax Assessment Tax Assessment Total Assessment is a certain percentage of the fair market value that is determined by local assessors to be the total taxable value of land and additions on the property. | Land | Improvement |
|---|---|---|---|---|
| 2025 | $2,621 | $234,850 | $77,955 | $156,895 |
| 2024 | -- | $228,250 | $74,457 | $153,793 |
| 2023 | $2,288 | $379,000 | $118,177 | $260,823 |
| 2022 | $2,437 | $218,350 | $66,852 | $151,498 |
| 2021 | $2,223 | $301,000 | $76,003 | $224,997 |
| 2020 | $1,949 | $262,000 | $64,890 | $197,110 |
| 2019 | $1,891 | $251,000 | $64,484 | $186,516 |
| 2018 | $1,740 | $225,000 | $54,374 | $170,626 |
| 2016 | $1,508 | $101,970 | $23,198 | $78,772 |
| 2015 | $1,381 | $88,990 | $23,198 | $65,792 |
| 2014 | $1,369 | $89,409 | $23,198 | $66,211 |
| 2013 | -- | $80,850 | $30,942 | $49,908 |
Source: Public Records
Map
Nearby Homes
- 1415 S 1250 E
- 1127 E 1050 S
- 1612 E 925 S
- 846 S 1625 E Unit C
- 1543 E 750 S Unit C5
- 865 S 1650 E Unit A
- 897 E 1000 S
- 1644 E 700 S
- 732 E 1000 S
- 1916 N Celia Way
- 1883 W 1575 N
- 1888 W 1575 N Unit 235
- 1888 W 1575 N
- 1870 N Celia Way
- 1858 W 1575 N Unit 240
- 1858 W 1575 N
- 1847 John St
- 1498 W 1850 N
- 2931 N 1175 W
- 2896 N 1175 W
- 1229 Valhalla Dr
- 1225 Valhalla Dr
- 1231 Valhalla Dr
- 1226 Valhalla Dr
- 1223 Valhalla Dr
- 1219 Valhalla Dr
- 1228 Valhalla Dr
- 1221 Valhalla Dr
- 1224 Valhalla Dr
- 1230 Valhalla Dr
- 1233 Valhalla Dr
- 1237 Valhalla Dr
- 1221 E 1100 S
- 1155 S 1100 E A-2
- 1223 E 1100 S
- 1217 Valhalla Dr
- 1232 Valhalla Dr
- 1220 Valhalla Dr
- 1235 Valhalla Dr
- 1217 E 1100 S
Your Personal Tour Guide
Ask me questions while you tour the home.