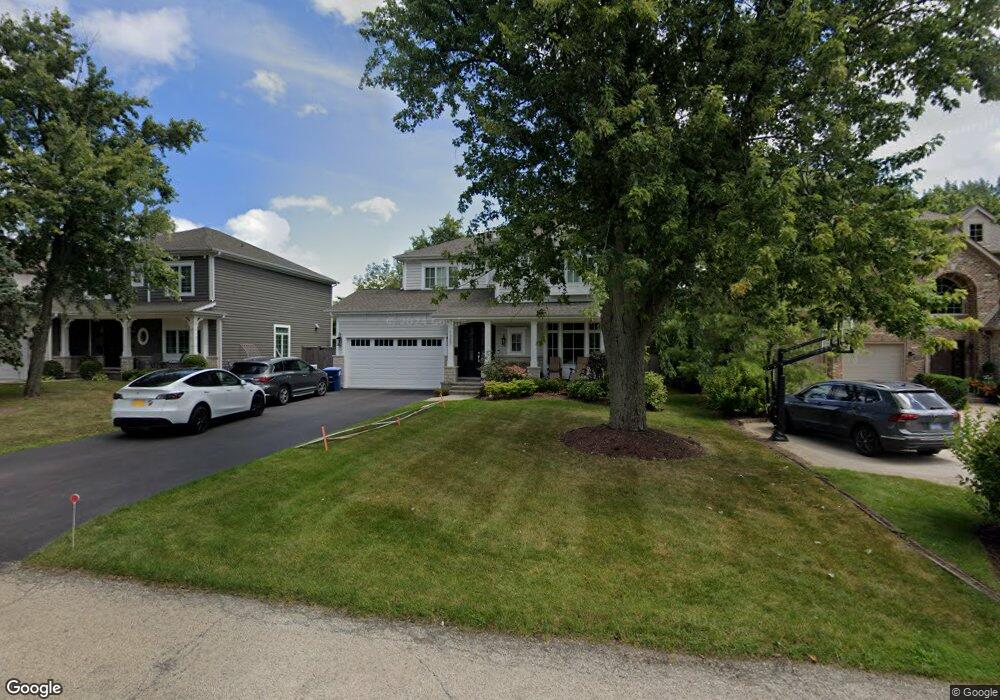
1227 Woodruff Ave Unit 2 Deerfield, IL 60015
Woodland NeighborhoodEstimated Value: $730,000 - $1,298,000
3
Beds
3
Baths
1,800
Sq Ft
$588/Sq Ft
Est. Value
About This Home
This home is located at 1227 Woodruff Ave Unit 2, Deerfield, IL 60015 and is currently estimated at $1,058,328, approximately $587 per square foot. 1227 Woodruff Ave Unit 2 is a home located in Lake County with nearby schools including Walden Elementary School, Alan B Shepard Middle School, and Deerfield High School.
Ownership History
Date
Name
Owned For
Owner Type
Purchase Details
Closed on
Jul 11, 2018
Sold by
Change Of Space Custom Homes Inc
Bought by
Gould Timothy and Newman Melissa
Current Estimated Value
Home Financials for this Owner
Home Financials are based on the most recent Mortgage that was taken out on this home.
Original Mortgage
$625,000
Outstanding Balance
$535,486
Interest Rate
4%
Mortgage Type
Adjustable Rate Mortgage/ARM
Estimated Equity
$522,842
Purchase Details
Closed on
Jun 26, 2017
Sold by
Rubenstein Barbara
Bought by
Change Of Space Custom Homes Inc
Purchase Details
Closed on
Aug 30, 1996
Sold by
Bickmore David F and Bickmore Leigh
Bought by
Rubenstein Howard and Rubenstein Barbara
Home Financials for this Owner
Home Financials are based on the most recent Mortgage that was taken out on this home.
Original Mortgage
$100,000
Interest Rate
8.27%
Create a Home Valuation Report for This Property
The Home Valuation Report is an in-depth analysis detailing your home's value as well as a comparison with similar homes in the area
Home Values in the Area
Average Home Value in this Area
Purchase History
| Date | Buyer | Sale Price | Title Company |
|---|---|---|---|
| Gould Timothy | $805,000 | First American Title | |
| Change Of Space Custom Homes Inc | $301,000 | Chicago Title | |
| Rubenstein Howard | $189,500 | Chicago Title Insurance Co |
Source: Public Records
Mortgage History
| Date | Status | Borrower | Loan Amount |
|---|---|---|---|
| Open | Gould Timothy | $625,000 | |
| Previous Owner | Rubenstein Howard | $100,000 |
Source: Public Records
Tax History Compared to Growth
Tax History
| Year | Tax Paid | Tax Assessment Tax Assessment Total Assessment is a certain percentage of the fair market value that is determined by local assessors to be the total taxable value of land and additions on the property. | Land | Improvement |
|---|---|---|---|---|
| 2024 | $26,663 | $303,587 | $44,425 | $259,162 |
| 2023 | $25,794 | $291,350 | $42,634 | $248,716 |
| 2022 | $25,794 | $278,287 | $45,793 | $232,494 |
| 2021 | $24,344 | $268,306 | $44,151 | $224,155 |
| 2020 | $27,098 | $304,270 | $44,244 | $260,026 |
| 2019 | $26,467 | $303,754 | $44,169 | $259,585 |
| 2018 | $3,957 | $46,815 | $46,815 | $0 |
| 2017 | $7,822 | $99,847 | $46,666 | $53,181 |
| 2016 | $7,598 | $96,071 | $44,901 | $51,170 |
| 2015 | $7,423 | $90,267 | $42,188 | $48,079 |
| 2014 | $6,111 | $76,429 | $42,491 | $33,938 |
| 2012 | $5,980 | $75,755 | $42,116 | $33,639 |
Source: Public Records
Map
Nearby Homes
- 1131 Linden Ave
- 1045 Fairoaks Ave
- 1342 Barclay Ln Unit 36
- 1041 Sheridan Ave
- 1444 Crowe Ave
- 1265 Woodland Dr
- 1410 Berkley Ct
- 1423 Northwoods Rd
- 1504 Northwoods Rd
- 904 Forest Ave
- 926 Cedar St
- 828 Chestnut St
- 1015 Deerfield Rd Unit 135
- 1119 Hampton Ct Unit 1
- 1770 Overland Trail
- 1620 Berkeley Ct
- 602 Warwick Rd
- 816 Appletree Ln
- 677 Timber Hill Rd
- 1027 Central Ave
- 1219 Woodruff Ave
- 1233 Woodruff Ave
- 1213 Woodruff Ave
- 1230 Parkside Ln
- 1236 Parkside Ln
- 1131 Greentree Ave
- 1119 Greentree Ave
- 1226 Parkside Ln
- 1228 Woodruff Ave
- 1222 Woodruff Ave
- 1236 Woodruff Ave
- 1132 Greenwood Ave
- 1124 Greenwood Ave
- 1214 Woodruff Ave
- 1214 Woodruff Ave Unit 2
- 1116 Greenwood Ave
- 1110 Greenwood Ave
- 1222 Parkside Ln
- 1239 Parkside Ln
- 1132 Greentree Ave