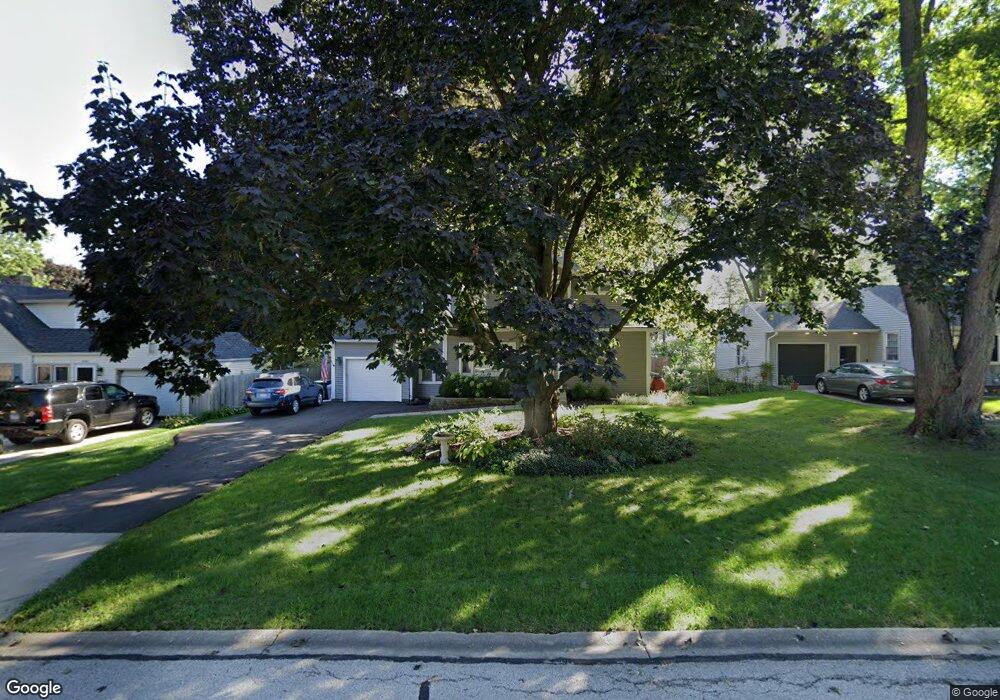
1228 Brandywine Cir Unit 3 Batavia, IL 60510
Southwest Batavia NeighborhoodEstimated Value: $342,000 - $413,000
3
Beds
3
Baths
1,617
Sq Ft
$223/Sq Ft
Est. Value
About This Home
This home is located at 1228 Brandywine Cir Unit 3, Batavia, IL 60510 and is currently estimated at $361,087, approximately $223 per square foot. 1228 Brandywine Cir Unit 3 is a home located in Kane County with nearby schools including Sam Rotolo Middle School, Batavia Sr High School, and Mooseheart Child City & School.
Ownership History
Date
Name
Owned For
Owner Type
Purchase Details
Closed on
Apr 7, 2017
Sold by
Rembert Julee A
Bought by
Cybulski Jeffrey T and Cybulski Melissa
Current Estimated Value
Home Financials for this Owner
Home Financials are based on the most recent Mortgage that was taken out on this home.
Original Mortgage
$251,143
Outstanding Balance
$207,014
Interest Rate
3.87%
Mortgage Type
FHA
Estimated Equity
$154,073
Purchase Details
Closed on
Mar 1, 2001
Sold by
Howard Jeffrey D and Howard Sandra M
Bought by
Rempert Julee A
Home Financials for this Owner
Home Financials are based on the most recent Mortgage that was taken out on this home.
Original Mortgage
$121,200
Interest Rate
7.03%
Purchase Details
Closed on
Jan 4, 2001
Sold by
Howard Sandra M and Lentz Robert G
Bought by
Howard Jeffrey D and Howard Sandra M
Home Financials for this Owner
Home Financials are based on the most recent Mortgage that was taken out on this home.
Original Mortgage
$121,200
Interest Rate
7.03%
Create a Home Valuation Report for This Property
The Home Valuation Report is an in-depth analysis detailing your home's value as well as a comparison with similar homes in the area
Home Values in the Area
Average Home Value in this Area
Purchase History
| Date | Buyer | Sale Price | Title Company |
|---|---|---|---|
| Cybulski Jeffrey T | $256,000 | Fidelity National Title | |
| Rempert Julee A | $151,500 | Greater Illinois Title Compa | |
| Howard Jeffrey D | -- | -- |
Source: Public Records
Mortgage History
| Date | Status | Borrower | Loan Amount |
|---|---|---|---|
| Open | Cybulski Jeffrey T | $251,143 | |
| Previous Owner | Rempert Julee A | $121,200 |
Source: Public Records
Tax History Compared to Growth
Tax History
| Year | Tax Paid | Tax Assessment Tax Assessment Total Assessment is a certain percentage of the fair market value that is determined by local assessors to be the total taxable value of land and additions on the property. | Land | Improvement |
|---|---|---|---|---|
| 2024 | $7,637 | $104,591 | $15,696 | $88,895 |
| 2023 | $7,459 | $94,928 | $14,246 | $80,682 |
| 2022 | $7,122 | $88,718 | $13,314 | $75,404 |
| 2021 | $6,829 | $84,141 | $12,627 | $71,514 |
| 2020 | $6,658 | $82,523 | $12,384 | $70,139 |
| 2019 | $6,309 | $77,000 | $11,946 | $65,054 |
| 2018 | $6,715 | $80,419 | $11,491 | $68,928 |
| 2017 | $5,255 | $63,596 | $11,112 | $52,484 |
| 2016 | $5,136 | $61,743 | $10,788 | $50,955 |
| 2015 | -- | $60,337 | $10,542 | $49,795 |
| 2014 | -- | $58,438 | $10,210 | $48,228 |
| 2013 | -- | $59,496 | $12,209 | $47,287 |
Source: Public Records
Map
Nearby Homes
- 818 Bernadette Ln
- 1280 Brandywine Cir
- 1316 Brandywine Cir Unit 4
- 1232 S Batavia Ave
- 1010 S Jefferson St
- 344 Danforth Dr
- 369 Danforth Dr
- 384 Danforth Dr
- 396 Danforth Dr
- 303 Danforth Dr
- 717 S Batavia Ave
- 524 Walnut St
- 1375 Green Pheasant Ln
- 245 Stone Manor Cir
- 1676 Carlstedt Dr
- 404 S Batavia Ave
- 231 Evergreen Dr
- 514 Main St
- 605 Main St
- 860 S River St
- 1224 Brandywine Cir
- 1232 Brandywine Cir Unit 1
- 763 Standish Ct
- 765 Standish Ct
- 1222 Brandywine Cir
- 801 Standish Ct
- 1240 Brandywine Cir
- 761 Standish Ct
- 1229 Brandywine Cir
- 1225 Brandywine Cir
- 1220 Brandywine Cir
- 1231 Brandywine Cir Unit 1
- 1221 Brandywine Cir
- 805 Standish Ct
- 759 Standish Ct
- 1219 Brandywine Cir
- 1248 Brandywine Cir Unit 1
- 1249 Brandywine Cir
- 701 Mount Vernon Place
- 1165 Concord Ct