Estimated Value: $303,533 - $363,000
4
Beds
2
Baths
2,206
Sq Ft
$151/Sq Ft
Est. Value
About This Home
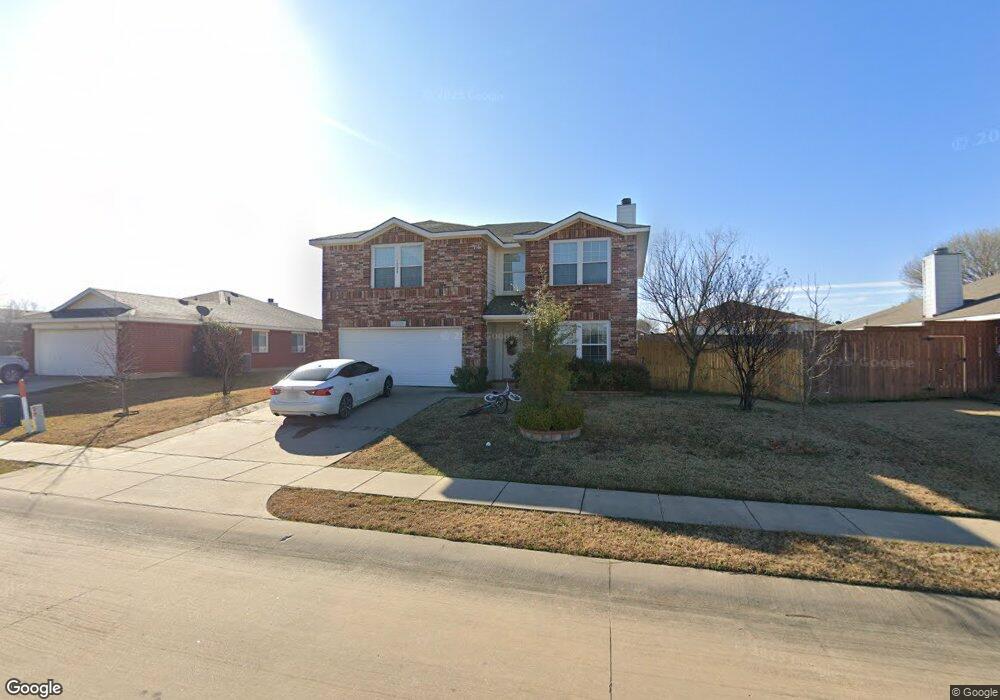
This home is located at 1228 Dakota Trail, Krum, TX 76249 and is currently estimated at $333,133, approximately $151 per square foot. 1228 Dakota Trail is a home located in Denton County with nearby schools including Krum Early Education Center, Blanche Dodd Intermediate School, and Krum Middle School.
Ownership History
Date
Name
Owned For
Owner Type
Purchase Details
Closed on
Jan 4, 2018
Sold by
Connelly Amanda Bennett and Bennett Mandy Zohlee
Bought by
Bennett Mandy Zohlee
Current Estimated Value
Home Financials for this Owner
Home Financials are based on the most recent Mortgage that was taken out on this home.
Original Mortgage
$137,800
Outstanding Balance
$116,287
Interest Rate
3.94%
Mortgage Type
New Conventional
Estimated Equity
$216,846
Purchase Details
Closed on
Sep 25, 2013
Sold by
Aleman Ramiro J and Hernandez Angelita
Bought by
Connelly Amanda and Connelly Dominic
Home Financials for this Owner
Home Financials are based on the most recent Mortgage that was taken out on this home.
Original Mortgage
$146,291
Interest Rate
4.87%
Mortgage Type
FHA
Purchase Details
Closed on
Oct 29, 2004
Sold by
Rh Of Texas Lp
Bought by
Aleman Ramiro J
Create a Home Valuation Report for This Property
The Home Valuation Report is an in-depth analysis detailing your home's value as well as a comparison with similar homes in the area
Home Values in the Area
Average Home Value in this Area
Purchase History
| Date | Buyer | Sale Price | Title Company |
|---|---|---|---|
| Bennett Mandy Zohlee | -- | None Available | |
| Connelly Amanda | -- | Stewart | |
| Aleman Ramiro J | -- | Rtc |
Source: Public Records
Mortgage History
| Date | Status | Borrower | Loan Amount |
|---|---|---|---|
| Open | Bennett Mandy Zohlee | $137,800 | |
| Closed | Connelly Amanda | $146,291 |
Source: Public Records
Tax History
| Year | Tax Paid | Tax Assessment Tax Assessment Total Assessment is a certain percentage of the fair market value that is determined by local assessors to be the total taxable value of land and additions on the property. | Land | Improvement |
|---|---|---|---|---|
| 2025 | $5,103 | $301,945 | $70,470 | $231,475 |
| 2024 | $6,342 | $314,719 | $0 | $0 |
| 2023 | $4,535 | $286,108 | $70,470 | $274,045 |
| 2022 | $5,966 | $260,098 | $70,470 | $209,023 |
| 2021 | $5,243 | $236,453 | $50,895 | $185,558 |
| 2020 | $4,908 | $216,717 | $42,282 | $174,435 |
| 2019 | $5,211 | $215,955 | $42,282 | $174,950 |
| 2018 | $4,761 | $196,323 | $42,282 | $154,041 |
| 2017 | $4,503 | $184,855 | $42,282 | $142,573 |
| 2016 | $4,133 | $169,659 | $25,839 | $148,250 |
| 2015 | $3,474 | $154,235 | $25,839 | $128,396 |
| 2014 | $3,474 | $141,257 | $25,839 | $115,418 |
| 2013 | -- | $139,297 | $25,839 | $113,458 |
Source: Public Records
Map
Nearby Homes
- 0 Farm To Market Road 1173
- 3207 Camden Creek Rd
- 1606 Withers Way
- 905 Clearview St
- 3425 Eloise Ln
- 105 Thoroughbred Dr
- 101 Thoroughbred Dr
- 334 Saddlebrook Dr
- 107 N 7th St
- 101 N 7th St
- 300 E 6th St
- TBD Masch Branch Rd
- 7272 Christina Ct
- 3725 Ranchers Ridge
- 3724 Ranchers Ridge
- 7257 Christina Ct
- 213 Dove Meadows
- 220 Brook Cir
- 5266 Meadow Ln
- 5258 Albert Ct
- 1226 Dakota Trail
- 1230 Dakota Trail
- 1227 Wenatchee Dr
- 1225 Wenatchee Dr
- 1229 Wenatchee Dr
- 1224 Dakota Trail
- 1223 Wenatchee Dr
- 1231 Dakota Trail
- 1231 Wenatchee Dr
- 1221 Wenatchee Dr
- 1302 Dakota Trail
- 1222 Dakota Trail
- 1303 Dakota Trail
- 1219 Wenatchee Dr
- 1228 Wenatchee Dr
- 1230 Wenatchee Dr
- 1226 Wenatchee Dr
- 1304 Dakota Trail
- 210 Pawnee Trail
- 1232 Wenatchee Dr
Your Personal Tour Guide
Ask me questions while you tour the home.