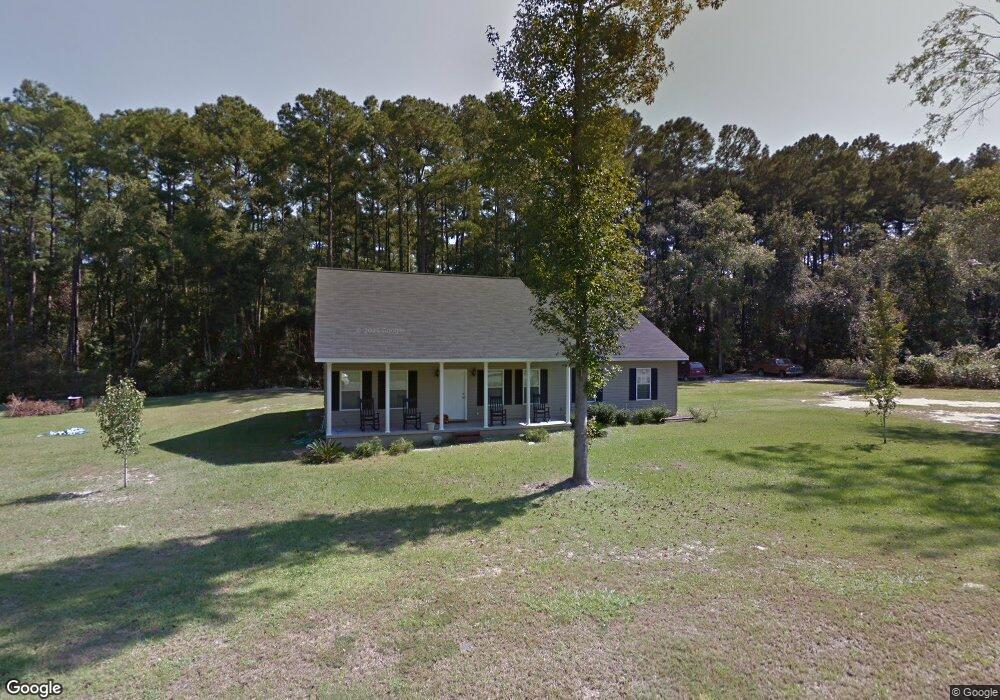
1228 Gobbler Ln Waycross, GA 31503
Estimated Value: $217,427 - $250,000
3
Beds
2
Baths
1,480
Sq Ft
$160/Sq Ft
Est. Value
About This Home
This home is located at 1228 Gobbler Ln, Waycross, GA 31503 and is currently estimated at $236,607, approximately $159 per square foot. 1228 Gobbler Ln is a home located in Ware County with nearby schools including Williams Heights Elementary School, Waycross Middle School, and Ware County High School.
Ownership History
Date
Name
Owned For
Owner Type
Purchase Details
Closed on
Jun 7, 2017
Sold by
Ray Griffin J
Bought by
Griffin Terry K
Current Estimated Value
Purchase Details
Closed on
Sep 26, 2012
Sold by
Griffin Terry K
Bought by
Griffin J Ray and Griffin Shirley E
Purchase Details
Closed on
Aug 28, 2006
Sold by
Griffin J Ray
Bought by
Griffin Terry K and Griffin Pamela A
Purchase Details
Closed on
Mar 17, 1997
Sold by
Griffin Jimmy R St
Bought by
Griffin J Ray
Purchase Details
Closed on
Nov 30, 1989
Bought by
Griffin Jimmy R St
Create a Home Valuation Report for This Property
The Home Valuation Report is an in-depth analysis detailing your home's value as well as a comparison with similar homes in the area
Home Values in the Area
Average Home Value in this Area
Purchase History
| Date | Buyer | Sale Price | Title Company |
|---|---|---|---|
| Griffin Terry K | -- | -- | |
| Griffin J Ray | $114,099 | -- | |
| Griffin Terry K | -- | -- | |
| Griffin J Ray | -- | -- | |
| Griffin Jimmy R St | -- | -- |
Source: Public Records
Tax History Compared to Growth
Tax History
| Year | Tax Paid | Tax Assessment Tax Assessment Total Assessment is a certain percentage of the fair market value that is determined by local assessors to be the total taxable value of land and additions on the property. | Land | Improvement |
|---|---|---|---|---|
| 2024 | $1,063 | $73,981 | $5,624 | $68,357 |
| 2023 | $1,084 | $66,938 | $8,200 | $58,738 |
| 2022 | $1,182 | $66,164 | $8,200 | $57,964 |
| 2021 | $1,234 | $56,947 | $8,200 | $48,747 |
| 2020 | $1,248 | $53,900 | $8,200 | $45,700 |
| 2019 | $1,272 | $43,002 | $8,200 | $34,802 |
| 2018 | $1,284 | $41,345 | $8,200 | $33,145 |
| 2017 | $1,348 | $41,345 | $8,200 | $33,145 |
| 2016 | $1,348 | $41,345 | $8,200 | $33,145 |
| 2015 | $1,361 | $41,345 | $8,200 | $33,145 |
| 2014 | $1,359 | $41,345 | $8,200 | $33,145 |
| 2013 | -- | $41,345 | $8,200 | $33,145 |
Source: Public Records
Map
Nearby Homes
- 1132 Hilltop Rd
- 4155 Pinecrest Rd
- 3817 Central Ave
- 1072 Lawhorne Dr
- 3070 Central Ave
- 867 Kentland Dr
- 630 Saddle Cir
- 2775 Seminole Trail
- 606 Stonewall Jackson Place
- 664 Saddle Cir
- 851 Carriage Ln
- 627 Saddle Cir
- 763 Kentland Dr
- 1049 Riverdale Dr
- 3153 Southwood Dr
- 723 St Bernard Trail
- 47 +/- Acres Live Oak Ln
- 955 Lynn Dr
- 1622 Booth St
- 914 Barkley St
- 1218 Gobbler Ln
- 3492 Cypress Cir
- 3482 Cypress Cir
- 1184 Gobbler Ln
- 3493 Robin Ridge
- 3483 Robin Ridge
- 3464 Cypress Cir
- 1166 Gobbler Ln
- 3473 Robin Ridge
- 3456 Cypress Cir
- 3490 Robin Ridge
- 3461 Robin Ridge
- 1146 Gobbler Ln
- 1146 Gobbler Ln
- 3478 Robin Ridge
- Lot 2 Gobbler Ln
- 3443 Robin Ridge
- 1133 Gobbler Ln
- 1128 Gobbler Ln
- 3464 Robin Ridge