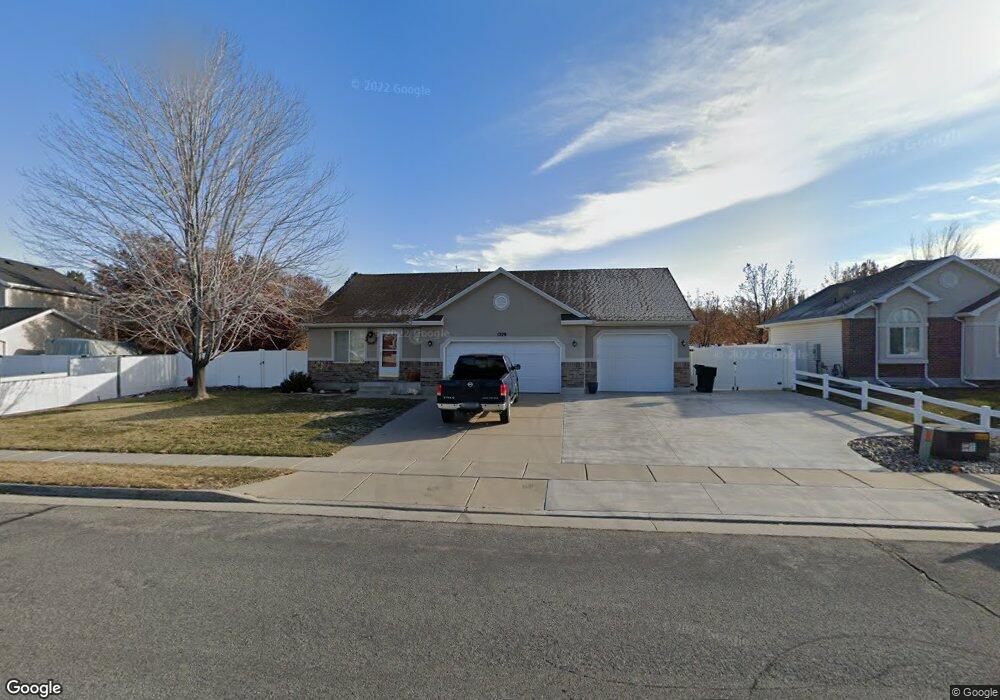
1228 N 1120 W Clearfield, UT 84015
Estimated Value: $539,000 - $561,000
6
Beds
3
Baths
2,536
Sq Ft
$217/Sq Ft
Est. Value
About This Home
This home is located at 1228 N 1120 W, Clearfield, UT 84015 and is currently estimated at $550,060, approximately $216 per square foot. 1228 N 1120 W is a home located in Davis County with nearby schools including Clinton Elementary School, Sunset Junior High School, and Clearfield High School.
Ownership History
Date
Name
Owned For
Owner Type
Purchase Details
Closed on
Nov 3, 2020
Sold by
Jensen Bert Louis and Jensen Elizabeth Gaye
Bought by
Jensen Bert L and Jensen Elizabeth G
Current Estimated Value
Purchase Details
Closed on
Jun 26, 2014
Sold by
Mccaustland Terrence A and Mccaustland Shirley A
Bought by
Jensen Bert Louise and Jensen Elizabeth Gaye
Home Financials for this Owner
Home Financials are based on the most recent Mortgage that was taken out on this home.
Original Mortgage
$166,500
Outstanding Balance
$126,500
Interest Rate
4.17%
Mortgage Type
New Conventional
Estimated Equity
$423,560
Purchase Details
Closed on
Dec 27, 2000
Sold by
Gmw Development Inc
Bought by
Mccaustland Terrence A and Mccaustland Shirley A
Home Financials for this Owner
Home Financials are based on the most recent Mortgage that was taken out on this home.
Original Mortgage
$148,371
Interest Rate
7.71%
Mortgage Type
VA
Create a Home Valuation Report for This Property
The Home Valuation Report is an in-depth analysis detailing your home's value as well as a comparison with similar homes in the area
Home Values in the Area
Average Home Value in this Area
Purchase History
| Date | Buyer | Sale Price | Title Company |
|---|---|---|---|
| Jensen Bert L | -- | None Available | |
| Jensen Bert Louise | -- | First American Title Co Llc | |
| Mccaustland Terrence A | -- | Bonneville Title Company Inc |
Source: Public Records
Mortgage History
| Date | Status | Borrower | Loan Amount |
|---|---|---|---|
| Open | Jensen Bert Louise | $166,500 | |
| Previous Owner | Mccaustland Terrence A | $148,371 |
Source: Public Records
Tax History Compared to Growth
Tax History
| Year | Tax Paid | Tax Assessment Tax Assessment Total Assessment is a certain percentage of the fair market value that is determined by local assessors to be the total taxable value of land and additions on the property. | Land | Improvement |
|---|---|---|---|---|
| 2025 | $2,911 | $279,950 | $93,812 | $186,138 |
| 2024 | $2,650 | $270,600 | $102,757 | $167,843 |
| 2023 | $2,650 | $260,700 | $64,650 | $196,049 |
| 2022 | $5,115 | $506,000 | $129,328 | $376,672 |
| 2021 | $4,844 | $391,000 | $90,356 | $300,644 |
| 2020 | $4,219 | $337,000 | $77,478 | $259,522 |
| 2019 | $2,269 | $322,000 | $89,243 | $232,757 |
| 2018 | $2,138 | $298,000 | $75,210 | $222,790 |
| 2016 | $1,737 | $125,015 | $27,768 | $97,247 |
| 2015 | $1,712 | $117,150 | $27,768 | $89,382 |
| 2014 | $1,650 | $114,692 | $27,768 | $86,924 |
| 2013 | -- | $98,924 | $27,143 | $71,781 |
Source: Public Records
Map
Nearby Homes