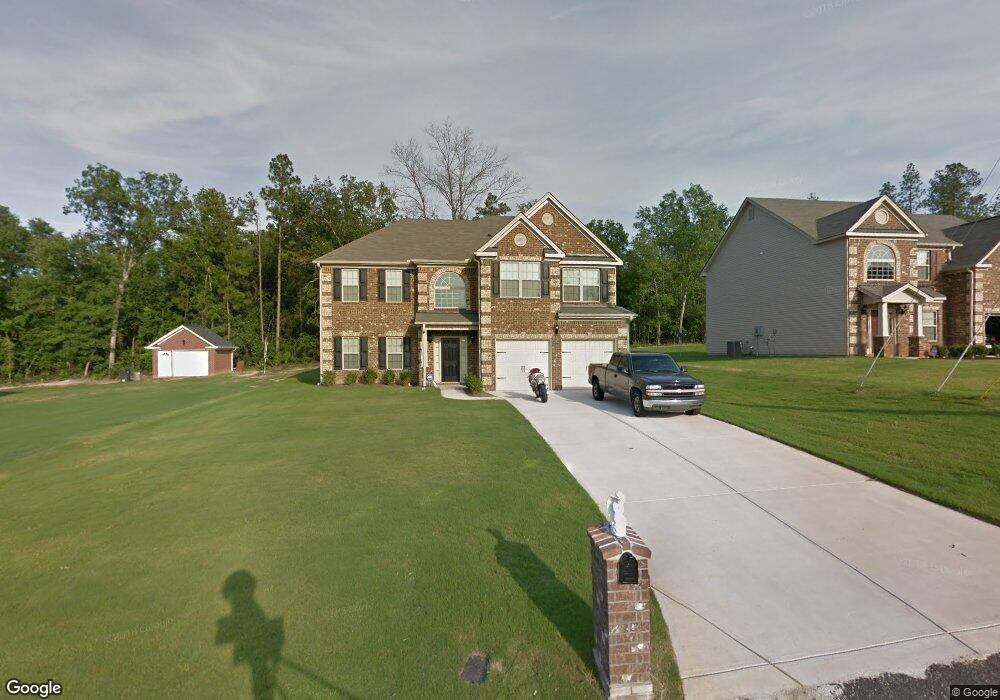
1228 Paramount Ct Hephzibah, GA 30815
Goshen NeighborhoodEstimated Value: $283,954 - $345,000
4
Beds
3
Baths
2,560
Sq Ft
$122/Sq Ft
Est. Value
About This Home
This home is located at 1228 Paramount Ct, Hephzibah, GA 30815 and is currently estimated at $311,739, approximately $121 per square foot. 1228 Paramount Ct is a home located in Richmond County with nearby schools including Goshen Elementary School, Pine Hill Middle School, and Johnson Magnet.
Ownership History
Date
Name
Owned For
Owner Type
Purchase Details
Closed on
Sep 19, 2011
Sold by
Johnson Jerome L
Bought by
Johnson Jerome L and Johnson Cassandra
Current Estimated Value
Home Financials for this Owner
Home Financials are based on the most recent Mortgage that was taken out on this home.
Original Mortgage
$147,115
Interest Rate
4.52%
Mortgage Type
New Conventional
Purchase Details
Closed on
Jul 25, 2011
Sold by
Pillon Communitites Inc
Bought by
Johnson Jerome L
Home Financials for this Owner
Home Financials are based on the most recent Mortgage that was taken out on this home.
Original Mortgage
$147,115
Interest Rate
4.52%
Mortgage Type
New Conventional
Purchase Details
Closed on
Nov 20, 1996
Sold by
Golmar Inc
Bought by
Johnson William
Create a Home Valuation Report for This Property
The Home Valuation Report is an in-depth analysis detailing your home's value as well as a comparison with similar homes in the area
Home Values in the Area
Average Home Value in this Area
Purchase History
| Date | Buyer | Sale Price | Title Company |
|---|---|---|---|
| Johnson Jerome L | $147,115 | -- | |
| Johnson Jerome L | $147,200 | -- | |
| Johnson Jerome L | $147,100 | -- | |
| Johnson Jerome L | $147,115 | -- | |
| Johnson William | $13,500 | -- |
Source: Public Records
Mortgage History
| Date | Status | Borrower | Loan Amount |
|---|---|---|---|
| Previous Owner | Johnson Jerome L | $147,115 | |
| Previous Owner | Johnson Jerome L | $139,759 |
Source: Public Records
Tax History Compared to Growth
Tax History
| Year | Tax Paid | Tax Assessment Tax Assessment Total Assessment is a certain percentage of the fair market value that is determined by local assessors to be the total taxable value of land and additions on the property. | Land | Improvement |
|---|---|---|---|---|
| 2025 | $3,354 | $112,320 | $9,400 | $102,920 |
| 2024 | $3,354 | $101,532 | $9,400 | $92,132 |
| 2023 | $2,170 | $93,224 | $9,400 | $83,824 |
| 2022 | $2,458 | $78,630 | $9,400 | $69,230 |
| 2021 | $2,111 | $60,804 | $9,400 | $51,404 |
| 2020 | $2,078 | $60,804 | $9,400 | $51,404 |
| 2019 | $2,201 | $60,804 | $9,400 | $51,404 |
| 2018 | $2,216 | $60,804 | $9,400 | $51,404 |
| 2017 | $2,169 | $60,804 | $9,400 | $51,404 |
| 2016 | $2,170 | $60,804 | $9,400 | $51,404 |
| 2015 | $2,185 | $60,804 | $9,400 | $51,404 |
| 2014 | $2,183 | $60,645 | $9,400 | $51,245 |
Source: Public Records
Map
Nearby Homes
- 4011 Brown Hurst Rd
- 3904 Goshen Ln N
- 2121 Southlake Pkwy
- 2114 Southlake Pkwy
- 4331 Big Dipper Cir
- 4302 E Barcelona Way
- 4304 E Barcelona Way
- 4306 E Barcelona Way
- 4383 E Barcelona Way
- 230 Goshen Rd - Tarragona&valencia Ln
- 230 Goshen Rd - Tarragona&valencia Ave
- 4371 E Barcelona Way
- 109 Essence Dr
- 113 Essence Dr
- 2601 Mike Padgett Hwy
- 3560 Mike Padgett Hwy
- 1228 Brown Rd
- 153 Essence Dr
- 157 Essence Dr
- 0 Mike Padgett Hwy Unit 22499809
- 1226 Paramount Ct
- 1217 Paramount Ct
- 1602 Vantage Way
- 1224 Paramount Ct
- 1232 Paramount Ct
- 1223 Paramount Ct
- 1234 Paramount Ct
- 1222 Paramount Ct
- 1227 Paramount Ct
- 1229 Paramount Ct
- 1221 Paramount Ct
- 1236 Paramount Ct
- 1220 Paramount Ct
- 1427 Commonwealth Way
- 1219 Paramount Ct
- 1429 Commonwealth Way
- 1231 Paramount Ct
- 1423 Commonwealth Way
- 1218 Paramount Ct
- 1238 Paramount Ct