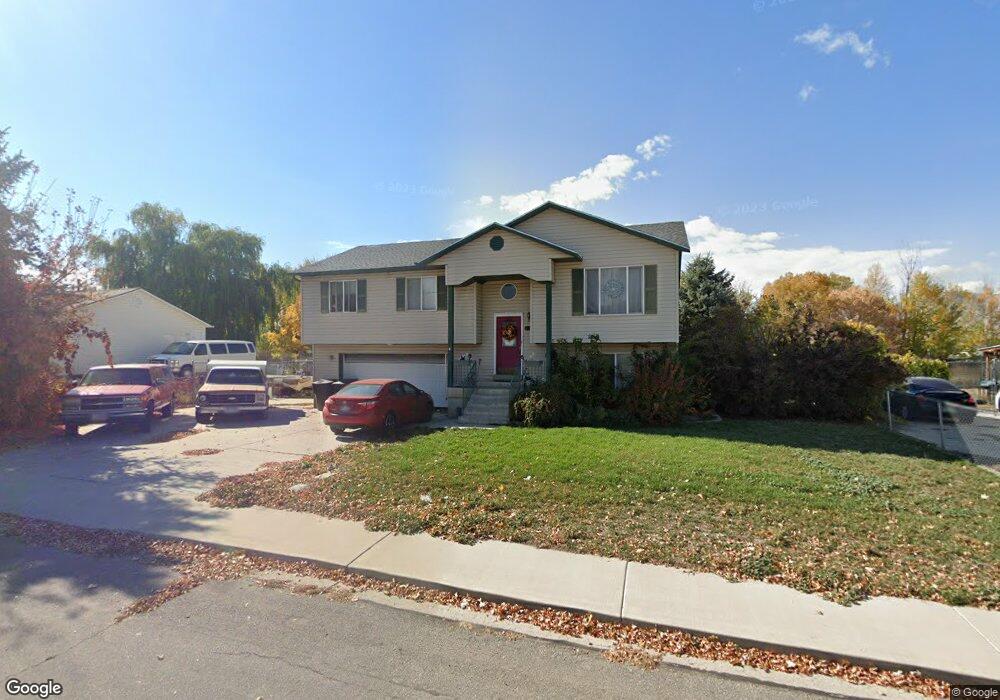
1228 S 880 W Payson, UT 84651
Estimated Value: $464,000 - $502,000
4
Beds
3
Baths
1,274
Sq Ft
$380/Sq Ft
Est. Value
About This Home
This home is located at 1228 S 880 W, Payson, UT 84651 and is currently estimated at $484,308, approximately $380 per square foot. 1228 S 880 W is a home located in Utah County with nearby schools including Wilson Elementary School, Payson Junior High School, and Mt. Nebo Junior High School.
Ownership History
Date
Name
Owned For
Owner Type
Purchase Details
Closed on
Jan 11, 2016
Sold by
Clark Dennis
Bought by
Clark Dennis B and Clark Maryrtley I
Current Estimated Value
Home Financials for this Owner
Home Financials are based on the most recent Mortgage that was taken out on this home.
Original Mortgage
$113,000
Outstanding Balance
$89,694
Interest Rate
3.9%
Mortgage Type
New Conventional
Estimated Equity
$394,614
Purchase Details
Closed on
Mar 16, 2002
Sold by
Thomas Russell James and Thomas Suzette
Bought by
Clark Dennis B and Clark Myrtle I
Create a Home Valuation Report for This Property
The Home Valuation Report is an in-depth analysis detailing your home's value as well as a comparison with similar homes in the area
Home Values in the Area
Average Home Value in this Area
Purchase History
| Date | Buyer | Sale Price | Title Company |
|---|---|---|---|
| Clark Dennis B | -- | None Available | |
| Clark Dennis | -- | Accommodation | |
| Clark Dennis B | -- | Wasatch Land & Title |
Source: Public Records
Mortgage History
| Date | Status | Borrower | Loan Amount |
|---|---|---|---|
| Open | Clark Dennis | $113,000 |
Source: Public Records
Tax History Compared to Growth
Tax History
| Year | Tax Paid | Tax Assessment Tax Assessment Total Assessment is a certain percentage of the fair market value that is determined by local assessors to be the total taxable value of land and additions on the property. | Land | Improvement |
|---|---|---|---|---|
| 2025 | $2,135 | $232,375 | $152,900 | $269,600 |
| 2024 | $2,135 | $217,250 | $0 | $0 |
| 2023 | $2,157 | $220,110 | $0 | $0 |
| 2022 | $2,173 | $218,130 | $0 | $0 |
| 2021 | $1,829 | $294,400 | $100,300 | $194,100 |
| 2020 | $1,707 | $268,900 | $87,200 | $181,700 |
| 2019 | $1,519 | $245,200 | $87,200 | $158,000 |
| 2018 | $1,337 | $208,100 | $67,700 | $140,400 |
| 2017 | $1,215 | $101,695 | $0 | $0 |
| 2016 | $1,167 | $97,075 | $0 | $0 |
| 2015 | $1,139 | $94,050 | $0 | $0 |
| 2014 | $1,092 | $90,860 | $0 | $0 |
Source: Public Records
Map
Nearby Homes
- 1172 S 880 W
- 1287 S 1080 W
- 1163 S 730 W
- 1087 S 680 W
- 802 Brookside Ct
- 1128 W 1150 S Unit 9
- 1002 W Temple Rim Ln
- 1216 S 1150 W Unit 19
- 1338 S 1150 W
- 1161 Utah 198
- 1192 W 1130 St S Unit 202
- 588 W 1450 S
- 1579 S 910 W
- 1582 S 790 W
- 1592 S 790 W
- 598 W Saddlebrook Dr
- 1597 S 1100 W
- 922 W 1620 S
- 1605 S 1100 W
- 1733 S 1100 W Unit 12