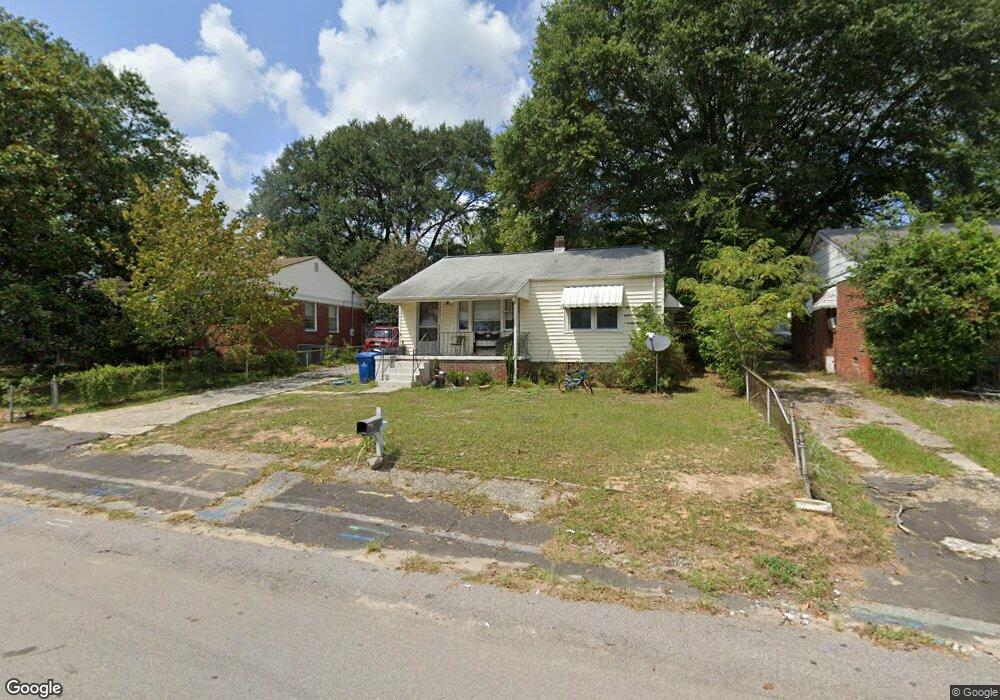
1228 Shull St West Columbia, SC 29169
Estimated Value: $136,000 - $206,000
3
Beds
2
Baths
1,086
Sq Ft
$154/Sq Ft
Est. Value
About This Home
This home is located at 1228 Shull St, West Columbia, SC 29169 and is currently estimated at $167,158, approximately $153 per square foot. 1228 Shull St is a home located in Lexington County with nearby schools including Riverbank Elementary, Cyril B. Busbee Creative Arts Academy, and Brookland-Cayce High School.
Ownership History
Date
Name
Owned For
Owner Type
Purchase Details
Closed on
Feb 24, 2022
Sold by
Bingenheimer Philip A
Bought by
Owens Victoria L and Branch Bobby Terrell
Current Estimated Value
Home Financials for this Owner
Home Financials are based on the most recent Mortgage that was taken out on this home.
Original Mortgage
$121,361
Outstanding Balance
$112,907
Interest Rate
3.55%
Mortgage Type
FHA
Estimated Equity
$54,251
Purchase Details
Closed on
Jan 10, 2014
Sold by
Fannie Mae
Bought by
Bingenheimer Philip A and Johnson James L
Purchase Details
Closed on
Sep 20, 2013
Sold by
Hohnadel Linda Rae
Bought by
Federal National Mortgage Association
Purchase Details
Closed on
Dec 16, 2004
Sold by
Wolfe Terry M and Wolfe Donna
Bought by
Hohnadel Linda Rae
Purchase Details
Closed on
Apr 13, 2004
Sold by
Martin Daisy M
Bought by
Wolfe Terry M
Purchase Details
Closed on
Apr 12, 2004
Sold by
B Of A Na
Bought by
Valentine Ryan R
Create a Home Valuation Report for This Property
The Home Valuation Report is an in-depth analysis detailing your home's value as well as a comparison with similar homes in the area
Home Values in the Area
Average Home Value in this Area
Purchase History
| Date | Buyer | Sale Price | Title Company |
|---|---|---|---|
| Owens Victoria L | $123,600 | Mp Morris Law Firm Pa | |
| Bingenheimer Philip A | $50,000 | -- | |
| Federal National Mortgage Association | $66,612 | -- | |
| Hohnadel Linda Rae | $79,000 | -- | |
| Wolfe Terry M | $26,500 | -- | |
| Valentine Ryan R | $40,000 | -- |
Source: Public Records
Mortgage History
| Date | Status | Borrower | Loan Amount |
|---|---|---|---|
| Open | Owens Victoria L | $121,361 |
Source: Public Records
Tax History Compared to Growth
Tax History
| Year | Tax Paid | Tax Assessment Tax Assessment Total Assessment is a certain percentage of the fair market value that is determined by local assessors to be the total taxable value of land and additions on the property. | Land | Improvement |
|---|---|---|---|---|
| 2024 | $933 | $7,416 | $720 | $6,696 |
| 2023 | $2,930 | $3,287 | $662 | $2,625 |
| 2022 | $1,230 | $3,287 | $662 | $2,625 |
| 2020 | $1,166 | $3,287 | $662 | $2,625 |
| 2019 | $1,024 | $2,858 | $600 | $2,258 |
| 2018 | $1,016 | $2,858 | $600 | $2,258 |
| 2017 | $997 | $2,858 | $600 | $2,258 |
| 2016 | $1,009 | $2,857 | $600 | $2,257 |
| 2014 | $870 | $2,838 | $600 | $2,238 |
| 2013 | -- | $2,840 | $600 | $2,240 |
Source: Public Records
Map
Nearby Homes