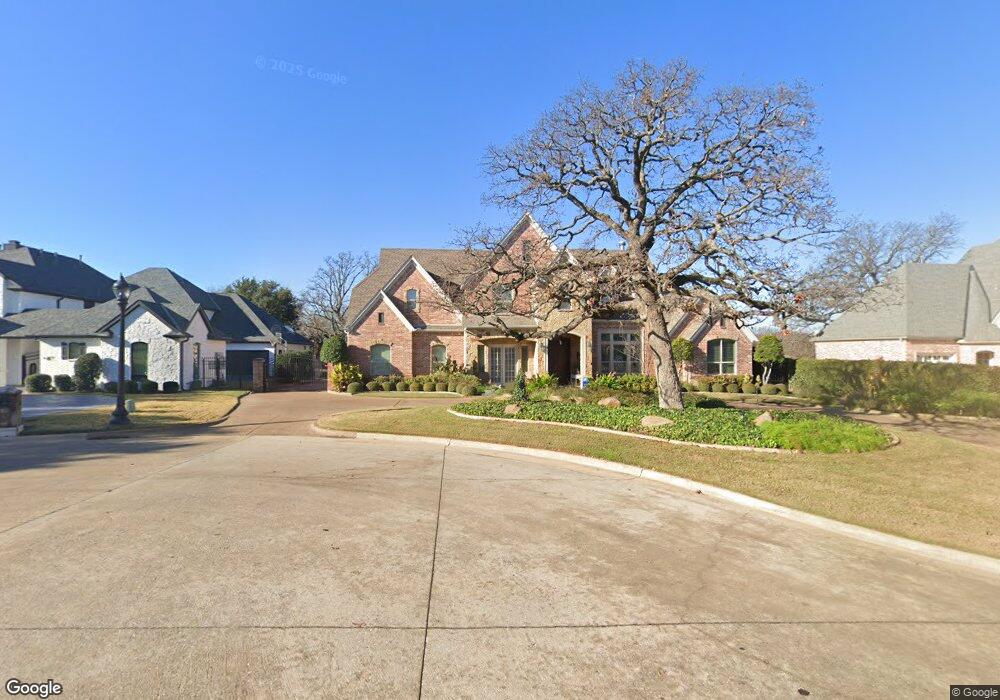
1228 Strathmore Dr Southlake, TX 76092
Estimated Value: $1,559,000 - $1,995,000
5
Beds
7
Baths
6,019
Sq Ft
$290/Sq Ft
Est. Value
About This Home
This home is located at 1228 Strathmore Dr, Southlake, TX 76092 and is currently estimated at $1,745,060, approximately $289 per square foot. 1228 Strathmore Dr is a home located in Tarrant County with nearby schools including Old Union Elementary School, Eubanks Intermediate School, and George Dawson Middle School.
Ownership History
Date
Name
Owned For
Owner Type
Purchase Details
Closed on
Oct 29, 2014
Sold by
Snyder Don S and Snyder Deborah D
Bought by
Wolf Jeffrey J and Wolf Janice M
Current Estimated Value
Home Financials for this Owner
Home Financials are based on the most recent Mortgage that was taken out on this home.
Original Mortgage
$836,000
Outstanding Balance
$646,258
Interest Rate
4.25%
Mortgage Type
New Conventional
Estimated Equity
$1,098,802
Purchase Details
Closed on
Jul 1, 1998
Sold by
Tom Adair Inc
Bought by
Snyder Don S and Snyder Deborah D
Home Financials for this Owner
Home Financials are based on the most recent Mortgage that was taken out on this home.
Original Mortgage
$600,000
Interest Rate
6.87%
Purchase Details
Closed on
Aug 21, 1997
Sold by
Westerra Timarron Lp
Bought by
Tom Adair Inc
Create a Home Valuation Report for This Property
The Home Valuation Report is an in-depth analysis detailing your home's value as well as a comparison with similar homes in the area
Home Values in the Area
Average Home Value in this Area
Purchase History
| Date | Buyer | Sale Price | Title Company |
|---|---|---|---|
| Wolf Jeffrey J | -- | None Available | |
| Snyder Don S | -- | American Title Company | |
| Tom Adair Inc | -- | American Title Company |
Source: Public Records
Mortgage History
| Date | Status | Borrower | Loan Amount |
|---|---|---|---|
| Open | Wolf Jeffrey J | $836,000 | |
| Previous Owner | Snyder Don S | $600,000 |
Source: Public Records
Tax History Compared to Growth
Tax History
| Year | Tax Paid | Tax Assessment Tax Assessment Total Assessment is a certain percentage of the fair market value that is determined by local assessors to be the total taxable value of land and additions on the property. | Land | Improvement |
|---|---|---|---|---|
| 2025 | $22,129 | $1,431,650 | $312,500 | $1,119,150 |
| 2024 | $22,129 | $1,431,650 | $312,500 | $1,119,150 |
| 2023 | $18,227 | $1,000,000 | $312,500 | $687,500 |
| 2022 | $28,079 | $1,301,500 | $231,250 | $1,070,250 |
| 2021 | $28,375 | $1,244,507 | $231,250 | $1,013,257 |
| 2020 | $27,135 | $1,249,292 | $231,250 | $1,018,042 |
| 2019 | $25,987 | $1,073,183 | $231,250 | $841,933 |
| 2018 | $26,545 | $1,153,020 | $323,750 | $829,270 |
| 2017 | $28,042 | $1,152,548 | $323,750 | $828,798 |
| 2016 | $25,493 | $1,028,500 | $323,750 | $704,750 |
| 2015 | $18,642 | $820,000 | $131,250 | $688,750 |
| 2014 | $18,642 | $820,000 | $131,250 | $688,750 |
Source: Public Records
Map
Nearby Homes
- 1227 Strathmore Dr
- 608 Regency Crossing
- 1420 Kensington Ct
- 521 Regency Crossing
- 710 Longford Dr
- 7312 Hix Ct
- 708 Nettleton Dr
- 7255 Oak Alley Dr
- 7322 Calloway Ct
- 7316 Calloway Ct
- 1417 Nottoway Ct
- 1418 Nottoway Ct
- 1406 Nottoway Ct
- 7200 Belle Meade Dr
- 7106 Belle Meade Dr
- 7012 Shepherds Glen
- TBD - Lot 3 John Mccain Rd
- TBD - Lot 1 John Mccain Rd
- 712 Ashleigh Ln
- 1100 La Paloma Ct
- 1230 Strathmore Dr
- 1226 Strathmore Dr
- 1229 Strathmore Dr
- 1224 Strathmore Dr
- 1225 Strathmore Dr
- 1223 Strathmore Dr
- 1222 Strathmore Dr
- 601 Fairway View Terrace
- 609 Fairway View Terrace
- 607 Fairway View Terrace
- 1405 Eagle Bend
- 605 Fairway View Terrace
- 1220 Strathmore Dr
- 1325 Eagle Bend Dr
- 1325 Eagle Bend
- 1329 Eagle Bend
- 603 Fairway View Terrace
- 1413 Eagle Bend
- 1333 Eagle Bend
- 611 Fairway View Terrace