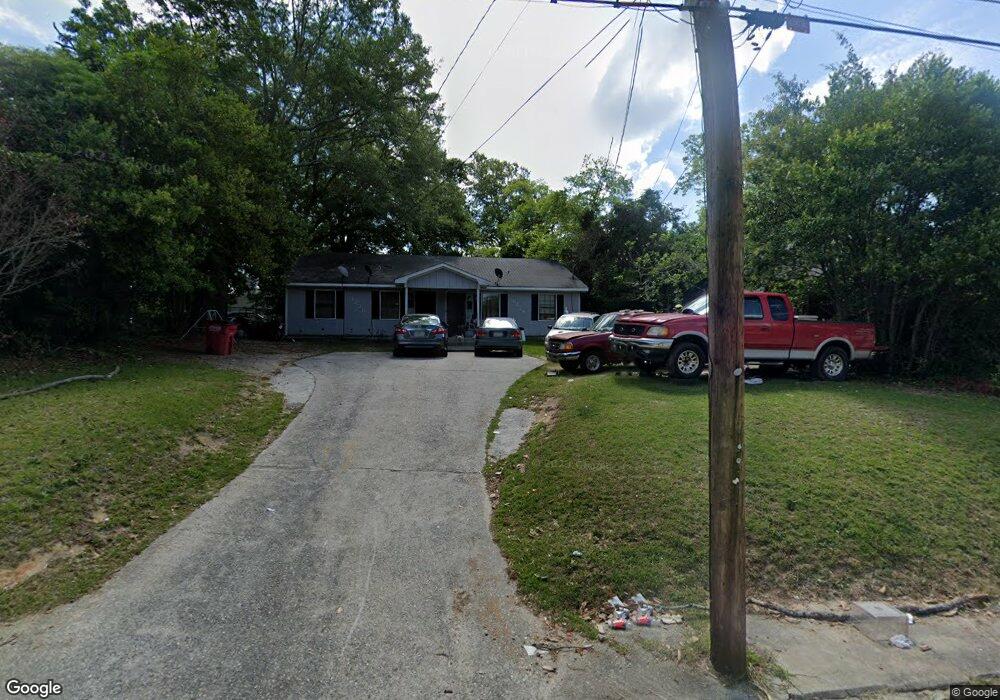
1228 Winton Ave Macon, GA 31204
Napier Heights Historic District NeighborhoodEstimated Value: $95,000 - $147,000
4
Beds
2
Baths
1,656
Sq Ft
$71/Sq Ft
Est. Value
About This Home
This home is located at 1228 Winton Ave, Macon, GA 31204 and is currently estimated at $118,197, approximately $71 per square foot. 1228 Winton Ave is a home located in Bibb County with nearby schools including Brookdale Elementary School, Miller Fine Arts Magnet Middle School, and Central High School.
Ownership History
Date
Name
Owned For
Owner Type
Purchase Details
Closed on
Aug 3, 2022
Sold by
Mfq Properties Llc
Bought by
Tango Real Estate Investments Llc
Current Estimated Value
Home Financials for this Owner
Home Financials are based on the most recent Mortgage that was taken out on this home.
Original Mortgage
$135,000
Outstanding Balance
$128,919
Interest Rate
5.7%
Mortgage Type
Construction
Estimated Equity
-$10,722
Purchase Details
Closed on
Aug 27, 2019
Sold by
Dma Properties Llc
Bought by
Mfq Properties Llc
Home Financials for this Owner
Home Financials are based on the most recent Mortgage that was taken out on this home.
Original Mortgage
$56,000
Interest Rate
3.8%
Mortgage Type
New Conventional
Purchase Details
Closed on
Jan 8, 2015
Sold by
Wingers Ruth
Bought by
Dina Properties Llc
Purchase Details
Closed on
Feb 9, 1993
Sold by
Wingers Hank W 1529 and Wingers 22
Bought by
Wingers Ruth
Create a Home Valuation Report for This Property
The Home Valuation Report is an in-depth analysis detailing your home's value as well as a comparison with similar homes in the area
Home Values in the Area
Average Home Value in this Area
Purchase History
| Date | Buyer | Sale Price | Title Company |
|---|---|---|---|
| Tango Real Estate Investments Llc | $90,000 | None Listed On Document | |
| Mfq Properties Llc | $35,000 | None Available | |
| Dina Properties Llc | $300,000 | -- | |
| Wingers Ruth | -- | -- |
Source: Public Records
Mortgage History
| Date | Status | Borrower | Loan Amount |
|---|---|---|---|
| Open | Tango Real Estate Investments Llc | $135,000 | |
| Previous Owner | Mfq Properties Llc | $56,000 |
Source: Public Records
Tax History Compared to Growth
Tax History
| Year | Tax Paid | Tax Assessment Tax Assessment Total Assessment is a certain percentage of the fair market value that is determined by local assessors to be the total taxable value of land and additions on the property. | Land | Improvement |
|---|---|---|---|---|
| 2025 | $982 | $39,955 | $2,760 | $37,195 |
| 2024 | $1,015 | $39,955 | $2,760 | $37,195 |
| 2023 | $1,090 | $36,789 | $1,660 | $35,129 |
| 2022 | $629 | $18,166 | $2,653 | $15,513 |
| 2021 | $650 | $17,096 | $2,653 | $14,443 |
| 2020 | $622 | $16,026 | $2,653 | $13,373 |
| 2019 | $301 | $7,693 | $1,297 | $6,396 |
| 2018 | $847 | $8,119 | $1,297 | $6,822 |
| 2017 | $304 | $8,119 | $1,297 | $6,822 |
| 2016 | $281 | $8,120 | $1,297 | $6,822 |
| 2015 | $398 | $8,120 | $1,297 | $6,822 |
| 2014 | $476 | $25,336 | $2,594 | $22,741 |
Source: Public Records
Map
Nearby Homes
- 1198 Winton Ave
- 2773 Beech Ave
- 1198 Brentwood Ave
- 2686 Napier Ave
- 1195 Brentwood Ave
- 1171 Brentwood Ave
- 1340 Courtland Ave
- 1154 Bartlett St
- 1285 Pio Nono Ave
- 1062 Bartlett St
- 1485 Brentwood Ave
- 2534 Napier Ave
- 2931 Gordon St
- 2696 Suwanee Ave
- 2713 Suwanee Ave
- 2793 Suwanee Ave
- 2485 Beech Ave
- 2497 Napier Ave
- 2723 Roy St
- 2753 Roy St
- 1226 Winton Ave
- 1210 Winton Ave
- 2734 Beech Ave
- 1227 Winton Ave
- 1207 Winton Ave
- 1249 Winton Ave
- 1274 Winton Ave
- 1221 Hillyer Ave
- 2739 Beech Ave
- 1255 Winton Ave
- 1249 Hillyer Ave
- 1213 Hillyer Ave
- 2729 Beech Ave
- 2729 Beech Ave Unit CR16
- 1267 Winton Ave
- 1187 Winton Ave
- 1261 Hillyer Ave
- 2770 Beech Ave Unit 2
- 2770 Beech Ave