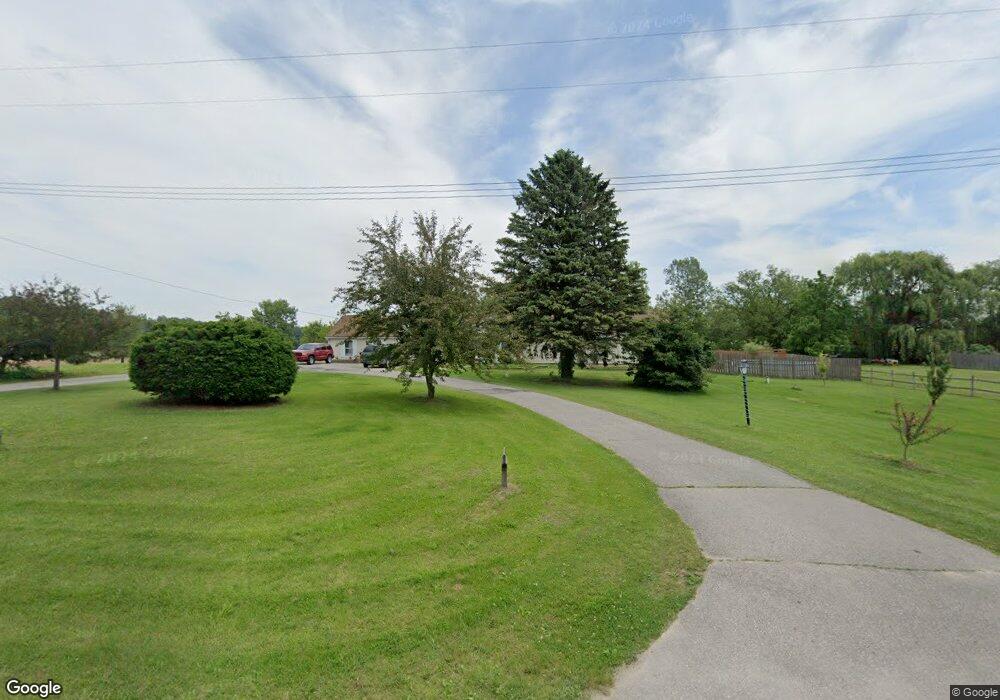
12280 Sumpter Rd Carleton, MI 48117
Estimated Value: $287,000 - $349,000
3
Beds
2
Baths
2,264
Sq Ft
$138/Sq Ft
Est. Value
About This Home
This home is located at 12280 Sumpter Rd, Carleton, MI 48117 and is currently estimated at $312,489, approximately $138 per square foot. 12280 Sumpter Rd is a home located in Monroe County with nearby schools including Airport Senior High School and St. Patrick Elementary School.
Ownership History
Date
Name
Owned For
Owner Type
Purchase Details
Closed on
Sep 1, 2017
Sold by
Henning David J and The Estate Of William George H
Bought by
Henning George
Current Estimated Value
Purchase Details
Closed on
Jun 21, 2011
Sold by
Fannie Mae
Bought by
Henning William G
Purchase Details
Closed on
Feb 24, 2011
Sold by
Bac Home Loans Servicing Llc
Bought by
Federal National Mortgage Association
Purchase Details
Closed on
Aug 26, 2010
Sold by
Langton Michael
Bought by
Bac Home Loans Servicing Lp
Purchase Details
Closed on
May 26, 2010
Sold by
Bryant Kelly L
Bought by
Bryant David M
Purchase Details
Closed on
Aug 9, 2002
Sold by
Lawson Jewell
Bought by
Bryant David and Bryant Kelly
Home Financials for this Owner
Home Financials are based on the most recent Mortgage that was taken out on this home.
Original Mortgage
$185,500
Interest Rate
6.56%
Mortgage Type
New Conventional
Create a Home Valuation Report for This Property
The Home Valuation Report is an in-depth analysis detailing your home's value as well as a comparison with similar homes in the area
Purchase History
| Date | Buyer | Sale Price | Title Company |
|---|---|---|---|
| Henning George | -- | None Available | |
| Henning William G | $41,000 | -- | |
| Federal National Mortgage Association | -- | -- | |
| Bac Home Loans Servicing Lp | $110,500 | -- | |
| Bryant David M | -- | -- | |
| Bryant David | $179,900 | -- |
Source: Public Records
Mortgage History
| Date | Status | Borrower | Loan Amount |
|---|---|---|---|
| Previous Owner | Bryant David | $185,500 |
Source: Public Records
Tax History
| Year | Tax Paid | Tax Assessment Tax Assessment Total Assessment is a certain percentage of the fair market value that is determined by local assessors to be the total taxable value of land and additions on the property. | Land | Improvement |
|---|---|---|---|---|
| 2025 | $770 | $129,850 | $129,850 | $0 |
| 2024 | $747 | $112,500 | $0 | $0 |
| 2023 | $711 | $94,700 | $0 | $0 |
| 2022 | $2,493 | $94,700 | $0 | $0 |
| 2021 | $2,456 | $86,250 | $0 | $0 |
| 2020 | $2,455 | $77,100 | $0 | $0 |
| 2019 | $2,458 | $77,100 | $0 | $0 |
| 2018 | $2,438 | $69,000 | $0 | $0 |
| 2017 | $2,305 | $69,000 | $0 | $0 |
| 2016 | $3,313 | $59,850 | $0 | $0 |
| 2015 | $3,268 | $54,500 | $0 | $0 |
| 2014 | $3,268 | $54,500 | $0 | $0 |
| 2013 | $2,411 | $53,700 | $0 | $0 |
Source: Public Records
Map
Nearby Homes
- 13680 Martinsville Rd
- 0 Hivon Rd
- 28710 Sumpter Rd
- 5571 Zink Rd
- 8085 W Newburg Rd
- 8200 Oakville Waltz Rd
- 13498 Exeter Rd
- Vl Sherwood Rd
- 9306 Raisin St
- 5942 Bluebush Rd
- 8705 Steffas Rd
- 8785 Sams Dr Unit 8793
- 8757- 8765 Sams
- 12259 Eldora St
- 26700 Martinsville Rd
- 9601 Exeter Rd
- 000 Tuttlehill Rd
- 7844 Kreps Dr
- 12464 Maxwell Rd
- 8650 Stone Rd
- 12250 Sumpter Rd
- 12279 Sumpter Rd
- 12130 Sumpter Rd
- 000 Stout and Sumpter
- 6014 Stout Rd
- 12333 Sumpter Rd
- 6060 Stout Rd
- 12120 Sumpter Rd
- 12155 Sumpter Rd
- 12391 Sumpter Rd
- 6070 Stout Rd
- 12518 Sumpter Rd
- 12526 Sumpter Rd
- 12527 Sumpter Rd
- 12109 Sumpter Rd
- 12544 Sumpter Rd
- 6097 Stout Rd
- 11982 Sumpter Rd
- 5857 Fay Rd
- 11929 Sumpter Rd
Your Personal Tour Guide
Ask me questions while you tour the home.