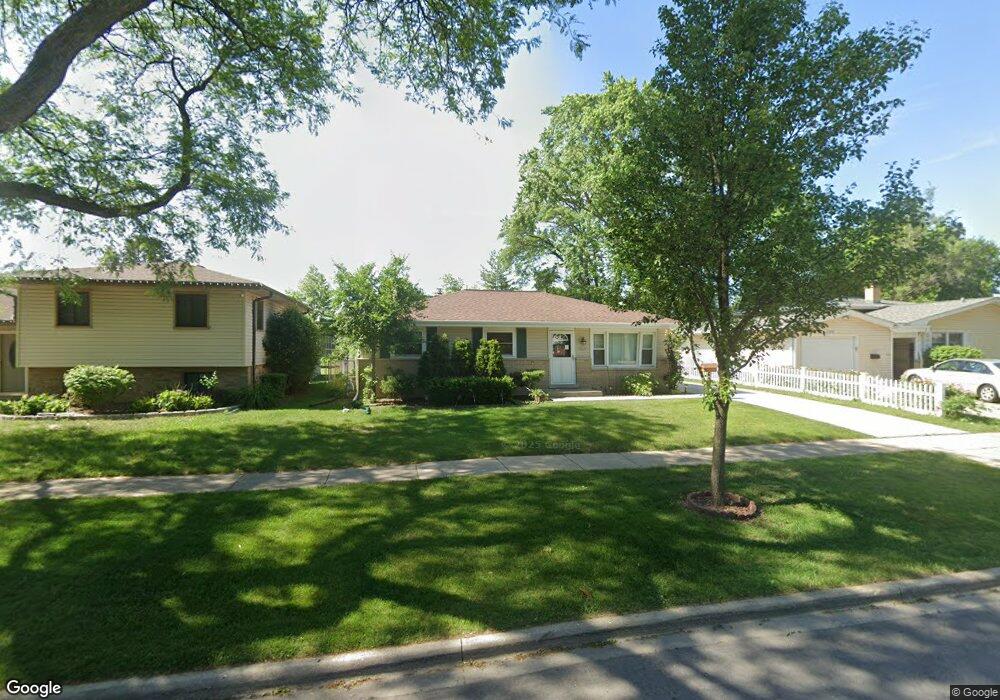
1229 Anthony Rd Wheeling, IL 60090
Estimated Value: $347,873 - $370,000
3
Beds
1
Bath
1,134
Sq Ft
$319/Sq Ft
Est. Value
About This Home
This home is located at 1229 Anthony Rd, Wheeling, IL 60090 and is currently estimated at $361,968, approximately $319 per square foot. 1229 Anthony Rd is a home located in Cook County with nearby schools including Booth Tarkington Elementary School, Jack London Middle School, and Wheeling High School.
Ownership History
Date
Name
Owned For
Owner Type
Purchase Details
Closed on
Mar 29, 2023
Sold by
Ridgeway David and Ridgeway Leslie
Bought by
Ridgeway David W and Ridgeway Leslie C
Current Estimated Value
Purchase Details
Closed on
May 24, 1999
Sold by
Peters Douglas J and Peters Kimberly
Bought by
Ridgeway David and Ridgeway Leslie
Home Financials for this Owner
Home Financials are based on the most recent Mortgage that was taken out on this home.
Original Mortgage
$127,200
Interest Rate
6.92%
Purchase Details
Closed on
Jan 19, 1996
Sold by
Britt William and Britt Joyce
Bought by
Peters Douglas J and Peters Kimberly J
Home Financials for this Owner
Home Financials are based on the most recent Mortgage that was taken out on this home.
Original Mortgage
$158,100
Interest Rate
7.19%
Mortgage Type
VA
Purchase Details
Closed on
May 26, 1994
Sold by
Golab Walter F
Bought by
Britt William and Britt Joyce
Create a Home Valuation Report for This Property
The Home Valuation Report is an in-depth analysis detailing your home's value as well as a comparison with similar homes in the area
Home Values in the Area
Average Home Value in this Area
Purchase History
| Date | Buyer | Sale Price | Title Company |
|---|---|---|---|
| Ridgeway David W | -- | None Listed On Document | |
| Ridgeway David | $159,000 | Chicago Title Insurance Co | |
| Peters Douglas J | $155,000 | Attorneys Title Guaranty Fun | |
| Britt William | -- | -- |
Source: Public Records
Mortgage History
| Date | Status | Borrower | Loan Amount |
|---|---|---|---|
| Previous Owner | Ridgeway David | $127,200 | |
| Previous Owner | Peters Douglas J | $158,100 |
Source: Public Records
Tax History
| Year | Tax Paid | Tax Assessment Tax Assessment Total Assessment is a certain percentage of the fair market value that is determined by local assessors to be the total taxable value of land and additions on the property. | Land | Improvement |
|---|---|---|---|---|
| 2025 | $6,932 | $30,000 | $7,182 | $22,818 |
| 2024 | $6,932 | $21,827 | $5,985 | $15,842 |
| 2023 | $6,578 | $24,000 | $5,985 | $18,015 |
| 2022 | $6,578 | $24,000 | $5,985 | $18,015 |
| 2021 | $6,011 | $19,554 | $4,588 | $14,966 |
| 2020 | $5,937 | $19,554 | $4,588 | $14,966 |
| 2019 | $6,043 | $21,873 | $4,588 | $17,285 |
| 2018 | $5,003 | $17,144 | $3,990 | $13,154 |
| 2017 | $4,922 | $17,144 | $3,990 | $13,154 |
| 2016 | $6,123 | $20,848 | $3,990 | $16,858 |
| 2015 | $5,830 | $18,986 | $3,391 | $15,595 |
| 2014 | $6,169 | $20,317 | $3,391 | $16,926 |
| 2013 | $5,676 | $20,317 | $3,391 | $16,926 |
Source: Public Records
Map
Nearby Homes
- 416 Trinity Ct
- 3026 Jackson Dr
- 175 Lake Blvd Unit 349
- 175 Lake Blvd Unit 345
- 353 E Norman Ln
- 400 E Dundee Rd Unit 403C
- 1504 Chippewa Trail
- 200 Lake Blvd Unit 402
- 492 Bernice Ct
- 2822 Jackson Dr
- 528 Surf Ct
- 2812 Jackson Dr
- 50 Lake Blvd Unit 632
- 665 Cindy Ln
- 1500 Canbury Ct Unit 11373
- 709 Lakeside Circle Dr Unit 2
- 671 Cedarwood Ct Unit 2
- 1516 Camden Ct Unit A1
- 700 Lakeside Circle Dr
- 1410 Tulip Ct Unit D2
- 1239 Anthony Rd
- 1219 Anthony Rd
- 1209 Anthony Rd
- 1249 Anthony Rd
- 1199 Anthony Rd
- 1259 Anthony Rd
- 1230 Anthony Rd
- 1220 Anthony Rd
- 1240 Anthony Rd
- 1210 Anthony Rd
- 1250 Anthony Rd
- 1101 Anthony Rd
- 1269 Anthony Rd
- 1200 Anthony Rd
- 1260 Anthony Rd
- 1102 Anthony Rd
- 3343 Schoenbeck Rd
- 1270 Anthony Rd
- 316 Robert Ave
- 1091 Anthony Rd
Your Personal Tour Guide
Ask me questions while you tour the home.