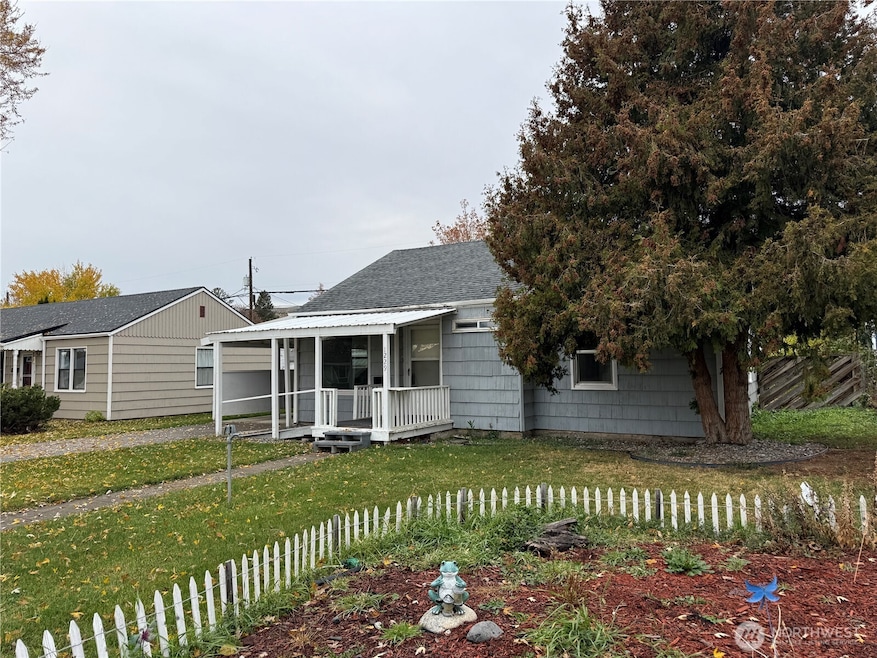
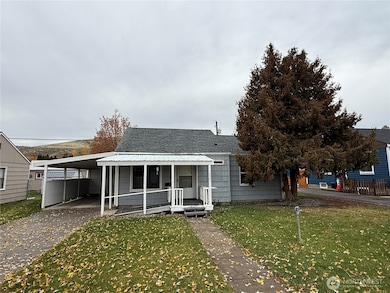
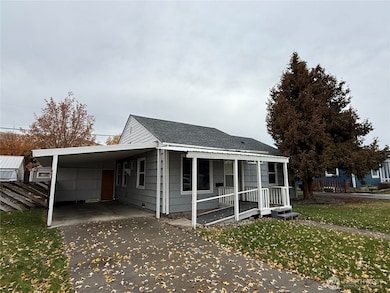
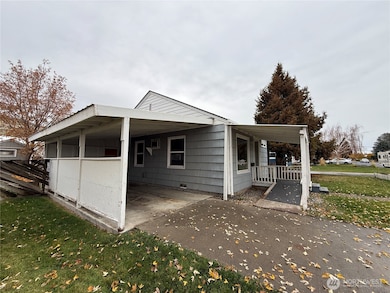
1229 C St SW Ephrata, WA 98823
Estimated payment $1,223/month
Highlights
- No HOA
- Patio
- 1-Story Property
- Storm Windows
- Bathroom on Main Level
- Attached Carport
About This Home
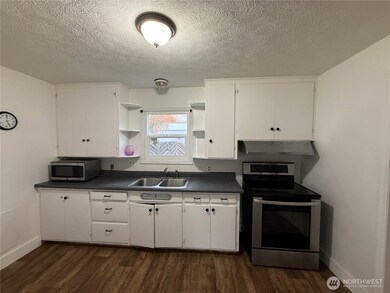
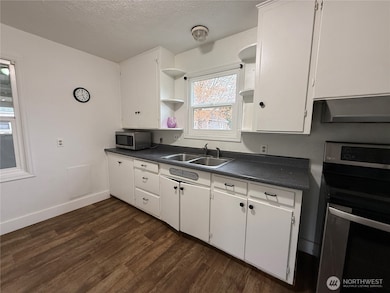
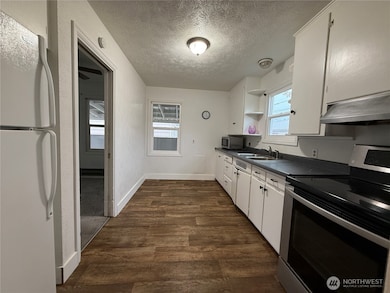
This home is a solid 2 bedroom 1 bath with carport and off street parking, great home to start your real estate investment. Roof was updated approx 5 years ago, garden space, fenced backyard, storage shed in the backyard. This cozy home has a good size living room, utility room with storage space, all appliances stay. Make an offer today!
Source: Northwest Multiple Listing Service (NWMLS)
MLS#: 2455141
Home Details
Home Type
- Single Family
Est. Annual Taxes
- $1,392
Year Built
- Built in 1948
Lot Details
- 5,441 Sq Ft Lot
- East Facing Home
- Partially Fenced Property
- Level Lot
- Sprinkler System
- Garden
- Property is in average condition
Home Design
- Poured Concrete
- Composition Roof
- Wood Composite
Interior Spaces
- 884 Sq Ft Home
- 1-Story Property
- Ceiling Fan
- Electric Fireplace
- Storm Windows
Kitchen
- Stove
- Microwave
Flooring
- Carpet
- Laminate
- Vinyl
Bedrooms and Bathrooms
- 2 Main Level Bedrooms
- Bathroom on Main Level
- 1 Full Bathroom
Laundry
- Dryer
- Washer
Parking
- 1 Parking Space
- Attached Carport
- Driveway
- Off-Street Parking
Outdoor Features
- Patio
- Outbuilding
Schools
- Ephrata Mid Middle School
- Ephrata High School
Utilities
- Cooling System Mounted In Outer Wall Opening
- Heating System Mounted To A Wall or Window
- High Speed Internet
Community Details
- No Home Owners Association
- Ephrata Subdivision
Listing and Financial Details
- Assessor Parcel Number 141201000
Map
Home Values in the Area
Average Home Value in this Area
Tax History
| Year | Tax Paid | Tax Assessment Tax Assessment Total Assessment is a certain percentage of the fair market value that is determined by local assessors to be the total taxable value of land and additions on the property. | Land | Improvement |
|---|---|---|---|---|
| 2025 | $1,407 | $133,686 | -- | -- |
| 2024 | $1,398 | $123,351 | $20,000 | $103,351 |
| 2023 | $1,387 | $107,270 | $20,000 | $87,270 |
| 2022 | $1,343 | $107,270 | $20,000 | $87,270 |
| 2021 | $1,235 | $107,270 | $20,000 | $87,270 |
| 2020 | $1,165 | $94,095 | $20,000 | $74,095 |
| 2019 | $814 | $76,210 | $20,000 | $56,210 |
| 2018 | $1,318 | $90,730 | $18,000 | $72,730 |
| 2017 | $1,153 | $84,670 | $18,000 | $66,670 |
| 2016 | $900 | $61,095 | $18,000 | $43,095 |
| 2013 | -- | $60,805 | $18,000 | $42,805 |
Property History
| Date | Event | Price | List to Sale | Price per Sq Ft |
|---|---|---|---|---|
| 11/15/2025 11/15/25 | For Sale | $210,000 | -- | $238 / Sq Ft |
Purchase History
| Date | Type | Sale Price | Title Company |
|---|---|---|---|
| Warranty Deed | $55,000 | Frontier Title & Escrow | |
| Interfamily Deed Transfer | -- | None Available | |
| Warranty Deed | $79,000 | Security Title Guaranty Inc |
Mortgage History
| Date | Status | Loan Amount | Loan Type |
|---|---|---|---|
| Previous Owner | $71,100 | New Conventional |
Source: Northwest Multiple Listing Service (NWMLS)
MLS Number: 2455141
APN: 141201000
Disclaimer: Certain information contained herein is derived from information provided by parties other than Homes.com. All information provided is deemed reliable, but is not guaranteed to be accurate and should be independently verified.
![]() All data is obtained from various sources and may not have been verified by broker or MLS GRID. Supplied Open House Information is subject to change without notice. All information should be independently reviewed and verified for accuracy. Properties may or may not be listed by the office/agent presenting the information. Listing information is provided by the Northwest Multiple Listing Service (NWMLS). Property information is based on available data that may include MLS information, county records, and other sources. Listings marked with the 3 tree icon and provided by NWMLS. All properties are subject to prior sale or withdrawal. IDX information is provided exclusively for consumers’ personal noncommercial use, that it may not be used for any purpose other than to identify prospective properties consumers may be interested in purchasing, that the data is deemed reliable but is not guaranteed by MLS GRID. ©2025 NWMLS.
All data is obtained from various sources and may not have been verified by broker or MLS GRID. Supplied Open House Information is subject to change without notice. All information should be independently reviewed and verified for accuracy. Properties may or may not be listed by the office/agent presenting the information. Listing information is provided by the Northwest Multiple Listing Service (NWMLS). Property information is based on available data that may include MLS information, county records, and other sources. Listings marked with the 3 tree icon and provided by NWMLS. All properties are subject to prior sale or withdrawal. IDX information is provided exclusively for consumers’ personal noncommercial use, that it may not be used for any purpose other than to identify prospective properties consumers may be interested in purchasing, that the data is deemed reliable but is not guaranteed by MLS GRID. ©2025 NWMLS.
Based on information submitted to the MLS GRID
