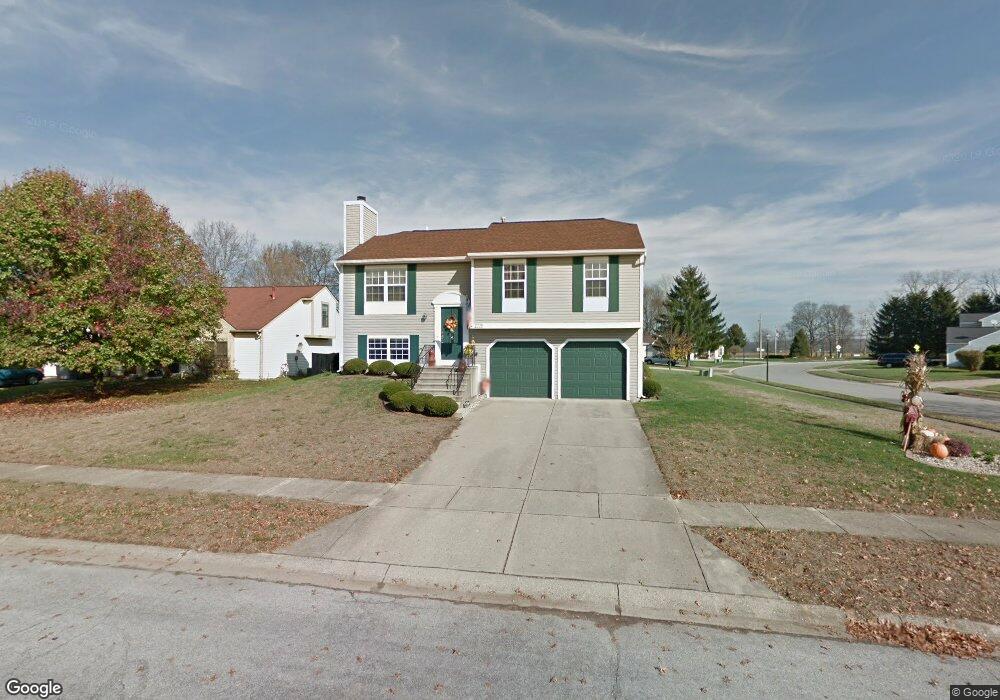
1229 Creekview Ct Fairborn, OH 45324
Estimated Value: $243,000 - $268,000
2
Beds
2
Baths
1,463
Sq Ft
$175/Sq Ft
Est. Value
About This Home
This home is located at 1229 Creekview Ct, Fairborn, OH 45324 and is currently estimated at $256,328, approximately $175 per square foot. 1229 Creekview Ct is a home located in Greene County with nearby schools including Fairborn Primary School, Fairborn Intermediate School, and Fairborn Middle School.
Ownership History
Date
Name
Owned For
Owner Type
Purchase Details
Closed on
Aug 22, 2022
Sold by
Finley Timothy E and Finley Erin E
Bought by
Aulakh Iqbal and Aulakh Harkirat Kaur
Current Estimated Value
Purchase Details
Closed on
Jun 10, 2005
Sold by
Bick Robert M
Bought by
Finley Timothy E
Home Financials for this Owner
Home Financials are based on the most recent Mortgage that was taken out on this home.
Original Mortgage
$100,800
Interest Rate
5.82%
Mortgage Type
Fannie Mae Freddie Mac
Purchase Details
Closed on
May 26, 2004
Sold by
Mudd James O
Bought by
Bick Robert M
Home Financials for this Owner
Home Financials are based on the most recent Mortgage that was taken out on this home.
Original Mortgage
$77,000
Interest Rate
5.99%
Mortgage Type
Unknown
Create a Home Valuation Report for This Property
The Home Valuation Report is an in-depth analysis detailing your home's value as well as a comparison with similar homes in the area
Home Values in the Area
Average Home Value in this Area
Purchase History
| Date | Buyer | Sale Price | Title Company |
|---|---|---|---|
| Aulakh Iqbal | $215,000 | None Listed On Document | |
| Finley Timothy E | $126,000 | -- | |
| Bick Robert M | $115,000 | Hallmark Title |
Source: Public Records
Mortgage History
| Date | Status | Borrower | Loan Amount |
|---|---|---|---|
| Previous Owner | Finley Timothy E | $100,800 | |
| Previous Owner | Bick Robert M | $77,000 | |
| Closed | Finley Timothy E | $18,900 |
Source: Public Records
Tax History Compared to Growth
Tax History
| Year | Tax Paid | Tax Assessment Tax Assessment Total Assessment is a certain percentage of the fair market value that is determined by local assessors to be the total taxable value of land and additions on the property. | Land | Improvement |
|---|---|---|---|---|
| 2024 | $3,212 | $67,060 | $17,040 | $50,020 |
| 2023 | $3,212 | $67,060 | $17,040 | $50,020 |
| 2022 | $2,745 | $49,370 | $11,360 | $38,010 |
| 2021 | $2,786 | $49,370 | $11,360 | $38,010 |
| 2020 | $2,800 | $49,370 | $11,360 | $38,010 |
| 2019 | $2,290 | $40,530 | $12,580 | $27,950 |
| 2018 | $2,315 | $40,530 | $12,580 | $27,950 |
| 2017 | $2,321 | $40,530 | $12,580 | $27,950 |
| 2016 | $2,321 | $40,640 | $12,580 | $28,060 |
| 2015 | $2,210 | $40,640 | $12,580 | $28,060 |
| 2014 | $2,136 | $40,640 | $12,580 | $28,060 |
Source: Public Records
Map
Nearby Homes
- 654 Sartell Dr
- 1296 Horizon Dr
- 625 Sharon Dr
- 1215 Cottage Court Dr
- 540 Dorado Dr
- 1137 Landsdale Dr
- 2113 Wellington Ct
- 1022 Stoneybrook Trail
- 3306 Westchester Ct
- 1036 Peidmont Dr
- 1310 Rona Village Blvd
- 1695 Wimbledon Dr
- 0 W Yellow Springs-Fairfield Rd
- 70 Waterford Blvd
- 1415 Artesian Ln
- 1034 Baywood Dr
- 1503 N Broad St
- 1798 Fawnwood Ct
- 1769 Fawnwood Ct
- 1779 Fawnwood Ct
- 1225 Creekview Ct
- 811 Hunters Ridge Dr
- 800 Hunters Ridge Dr
- 808 Hunters Ridge Dr
- 1235 Northcliff Ct
- 1224 Creekview Ct
- 815 Hunters Ridge Dr
- 1221 Creekview Ct
- 816 Hunters Ridge Dr
- 1245 Northcliff Ct
- 1215 Creekview Ct
- 1220 Creekview Ct
- 783 Hunters Ridge Dr
- 821 Hunters Ridge Dr
- 1230 Northcliff Ct
- 775 Hunters Ridge Dr
- 1249 Northcliff Ct
- 952 Black Ln
- 5992 Black Ln
- 1236 Northcliff Ct