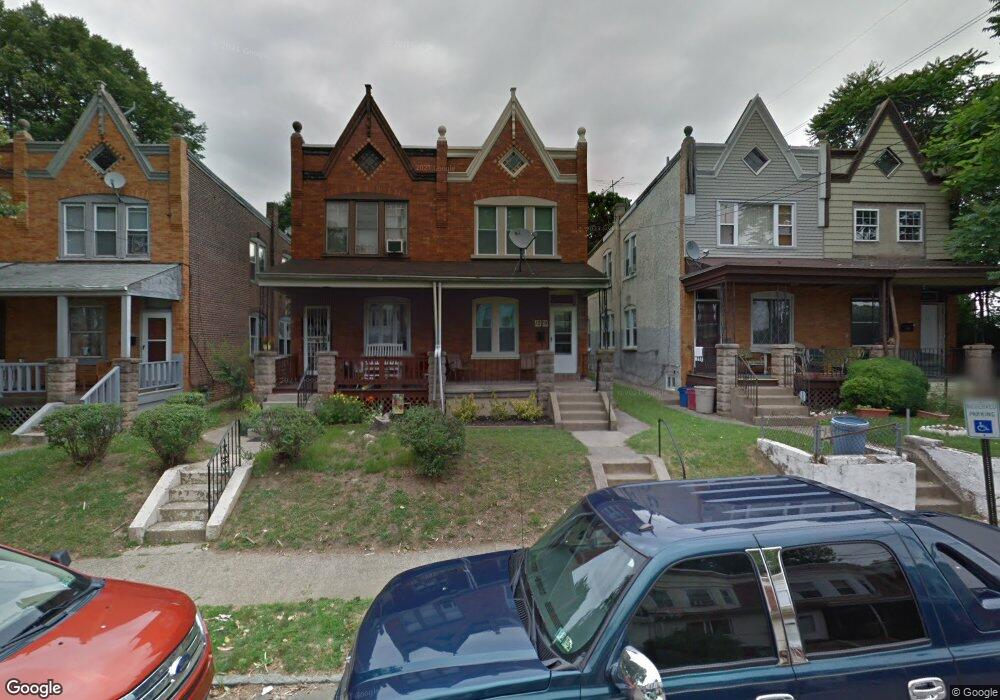
1229 Crosby St Chester, PA 19013
Estimated Value: $106,214 - $178,000
4
Beds
2
Baths
2,060
Sq Ft
$68/Sq Ft
Est. Value
About This Home
This home is located at 1229 Crosby St, Chester, PA 19013 and is currently estimated at $140,304, approximately $68 per square foot. 1229 Crosby St is a home located in Delaware County with nearby schools including Widener Partnership Charter School, Chester Community Charter School, and Drexel Newman Academy.
Ownership History
Date
Name
Owned For
Owner Type
Purchase Details
Closed on
Mar 30, 2021
Sold by
Best Homes Ddj Llc
Bought by
Chester Rei 3
Current Estimated Value
Home Financials for this Owner
Home Financials are based on the most recent Mortgage that was taken out on this home.
Original Mortgage
$3,167,500
Interest Rate
3%
Mortgage Type
Commercial
Purchase Details
Closed on
Oct 27, 2011
Sold by
Dececco David and Desimone Deborah
Bought by
Best Homes Ddj Llc
Purchase Details
Closed on
Aug 25, 2011
Sold by
Fannie Mae
Bought by
Dececco David and Desimone Devborah
Purchase Details
Closed on
Feb 28, 2011
Sold by
Clifford Scott and Aurora Loan Services Llc
Bought by
Federal National Mortgage Association
Purchase Details
Closed on
Dec 22, 2003
Sold by
Clifford Scott and Clifford Steve
Bought by
Clifford Scott
Home Financials for this Owner
Home Financials are based on the most recent Mortgage that was taken out on this home.
Original Mortgage
$36,800
Interest Rate
5.12%
Mortgage Type
Stand Alone Refi Refinance Of Original Loan
Create a Home Valuation Report for This Property
The Home Valuation Report is an in-depth analysis detailing your home's value as well as a comparison with similar homes in the area
Home Values in the Area
Average Home Value in this Area
Purchase History
| Date | Buyer | Sale Price | Title Company |
|---|---|---|---|
| Chester Rei 3 | $2,552,951 | Turks Head Abstracting Co | |
| Best Homes Ddj Llc | $10,000 | None Available | |
| Dececco David | $15,116 | None Available | |
| Federal National Mortgage Association | -- | None Available | |
| Clifford Scott | -- | Commonwealth Title |
Source: Public Records
Mortgage History
| Date | Status | Borrower | Loan Amount |
|---|---|---|---|
| Previous Owner | Chester Rei 3 | $3,167,500 | |
| Previous Owner | Clifford Scott | $36,800 |
Source: Public Records
Tax History Compared to Growth
Tax History
| Year | Tax Paid | Tax Assessment Tax Assessment Total Assessment is a certain percentage of the fair market value that is determined by local assessors to be the total taxable value of land and additions on the property. | Land | Improvement |
|---|---|---|---|---|
| 2025 | $1,227 | $44,990 | $16,010 | $28,980 |
| 2024 | $1,227 | $44,990 | $16,010 | $28,980 |
| 2023 | $1,261 | $44,990 | $16,010 | $28,980 |
| 2022 | $1,284 | $44,990 | $16,010 | $28,980 |
| 2021 | $576 | $44,990 | $16,010 | $28,980 |
| 2020 | $214 | $39,200 | $15,890 | $23,310 |
| 2019 | $214 | $39,200 | $15,890 | $23,310 |
| 2018 | $220 | $39,200 | $0 | $0 |
| 2017 | $220 | $39,200 | $0 | $0 |
| 2016 | $215 | $39,200 | $0 | $0 |
| 2015 | $220 | $39,200 | $0 | $0 |
| 2014 | $220 | $39,200 | $0 | $0 |
Source: Public Records
Map
Nearby Homes